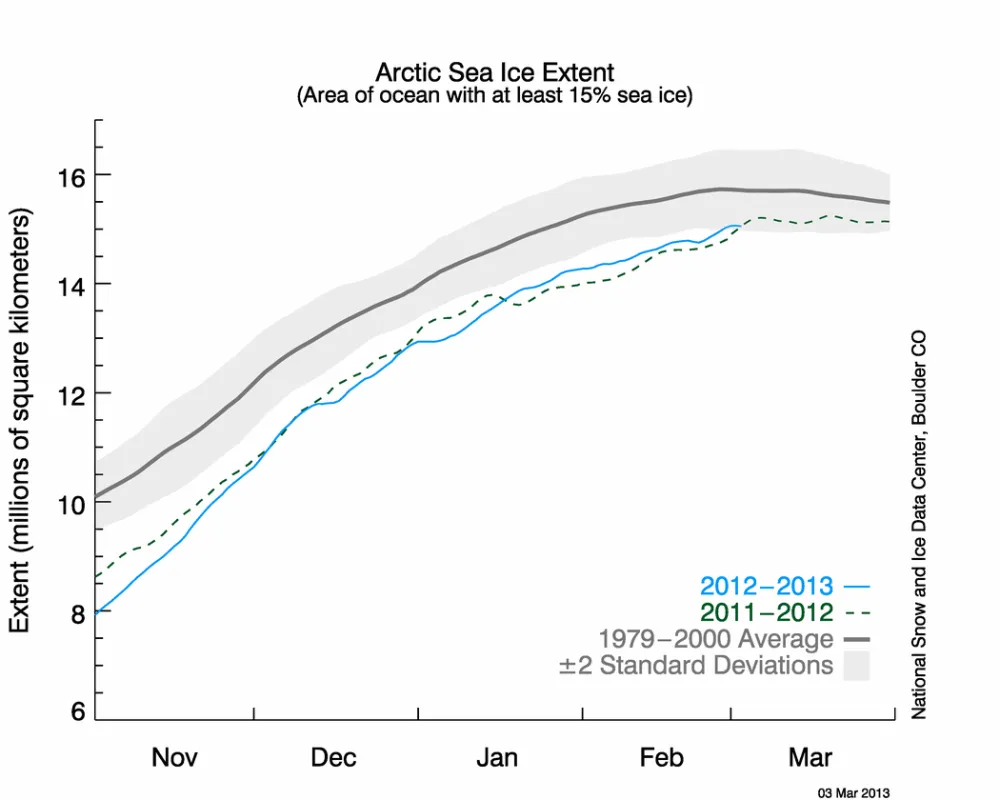
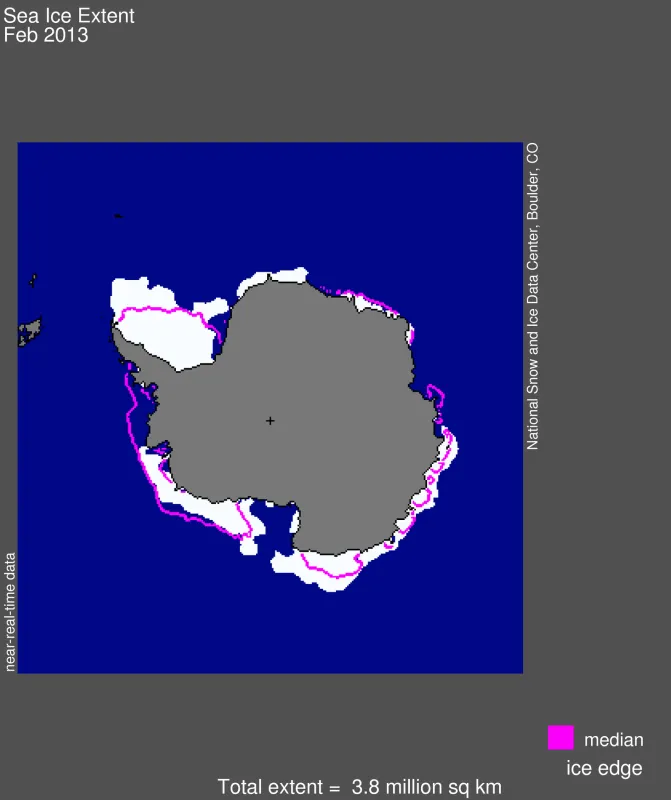
Arctic sea ice is nearing its winter maximum and will soon begin its seasonal decline. Ice extent remains below average, in part a result of the persistence of the negative phase of the Arctic Oscillation that has kept winter temperatures warmer than average. The Antarctic passed its summer minimum ice extent, reaching the second highest level in the satellite record at this time of year, primarily due to continued higher-than-average ice in the Weddell Sea.
Overview of conditions
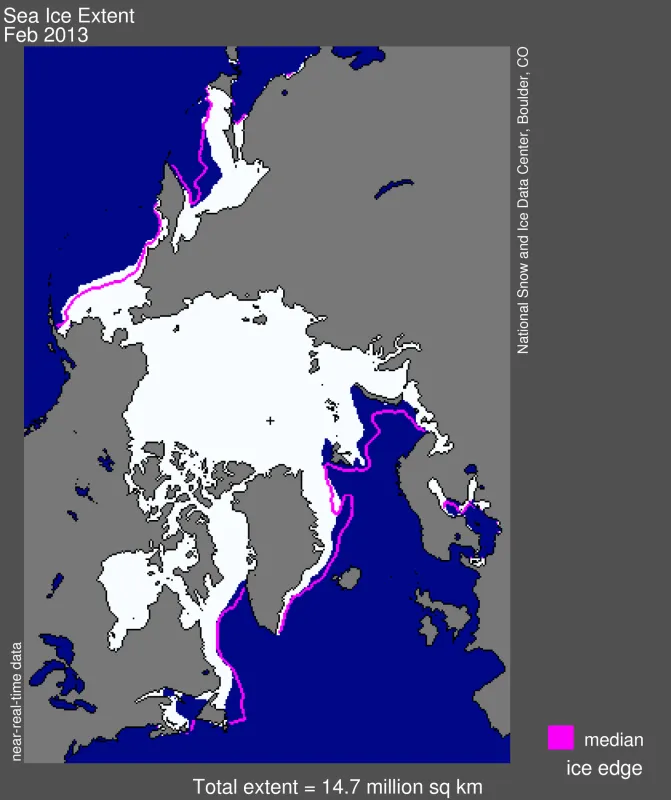
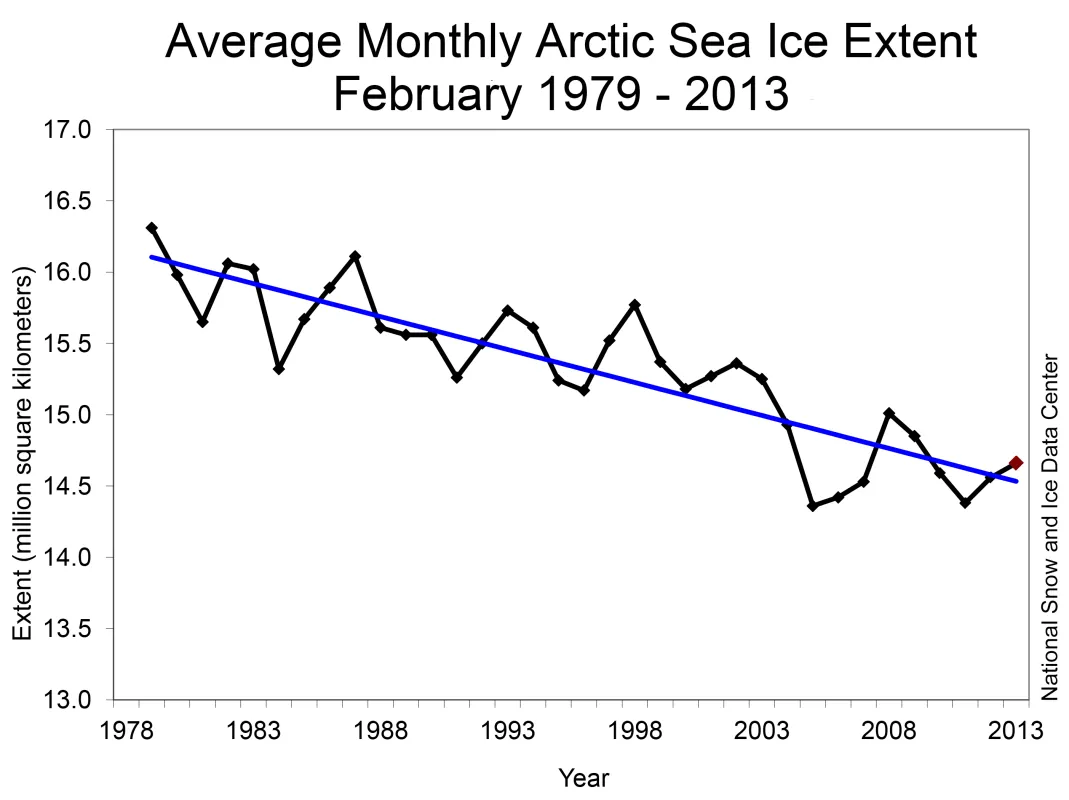
Average sea ice extent for February 2013 was 14.66 million square kilometers (5.66 million square miles). This is 980,000 square kilometers (378,000 square miles) below the 1979 to 2000 average for the month, and is the seventh-lowest February extent in the satellite record. Since 2004, the February average extent has remained below 15 million square kilometers (5.79 million square miles) every year except 2008. Prior to 2004, February average extent had never been less than 15 million square kilometers. Ice extent remains slightly below average everywhere except the Bering Sea.
Conditions in context
Through the month of February, the Arctic gained 766,000 square kilometers of ice (296,000 square miles), which is 38% higher than the 1979 to 2000 average for the month. Air temperatures at the 925 hPa level were 2 to 5 degrees Celsius (4 to 9 degrees Fahrenheit) higher than average across the Atlantic sector of the Arctic, especially near Iceland and in Baffin Bay. Temperatures were lower than average by 2 to 6 degrees Celsius (4 to 11 degrees Fahrenheit) north of Greenland and the Canadian Archipelago, and in the Beaufort, Chukchi and East Siberian seas, linked to anomalously low sea level pressure over Alaska and Canada. The dominant feature of Arctic sea level pressure for February 2013 was unusually high pressure over the East Greenland and Barents seas, consistent with a predominantly negative phase of the Arctic Oscillation.
February 2013 compared to previous years
Average Arctic sea ice extent for February 2013 was the seventh lowest for the month in the satellite record. Through 2013, the linear rate of decline for February ice extent is -2.9% per decade relative to the 1979 to 2000 average. Although the relative reduction in winter sea ice extent remains small compared to reductions in summer, the linear trend represents an overall reduction of more than 1.57 million square kilometers (606,000 square miles) from 1979 to 2013.
Persistence of the negative phase of the Arctic Oscillation
As discussed in the January and February posts, sea level pressure in the Arctic has remained higher than average, resulting in persistence of the negative phase of the Arctic Oscillation (AO). During the negative phase of the Arctic Oscillation, enhanced poleward transport of warm air tends to keep temperatures in the Arctic above average. At the same time, the negative phase of the Arctic Oscillation allows for more cold Arctic air to intrude or mix with air at lower latitudes. These cold air outbreaks can result in low temperatures and increased storminess in mid latitudes.
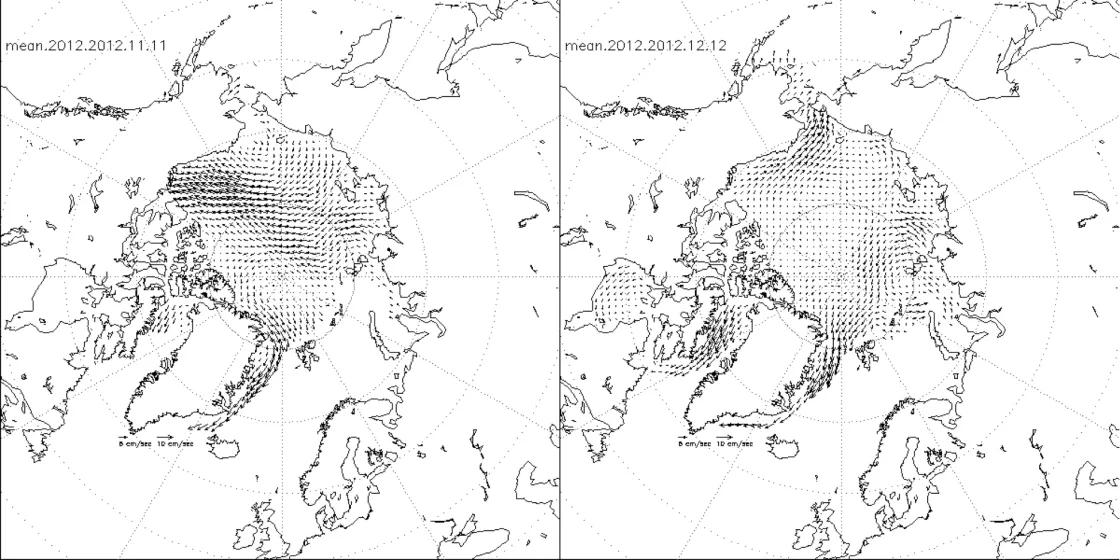
The Arctic Oscillation also impacts sea ice movement in the Arctic. The negative phase of the Arctic Oscillation is linked to an increase in the strength of the Beaufort Gyre and reduced outflow of ice through Fram Strait. A negative AO used to help promote ice survival through summer by strengthening the Beaufort Gyre and thereby increasing the distribution of old, thick ice along coastal Alaska and Siberia. However, the location and strength of positive sea level pressure anomalies has varied throughout winter, with varied impacts on ice motion.
For example, during November (weak AO index of -0.111) positive sea level pressure anomalies were centered over the Bering Sea and Alaska, resulting in strong ice motion from the central Arctic towards coastal Canada and north of Greenland outwards towards Fram Strait. In December, the strong negative AO index of -1.749 was reflected in positive sea level pressure anomalies centered over the Kara and Barents seas, enhancing ice motion from the southern Beaufort into the Chukchi sea and out towards the Bering Sea. Export of ice out of Fram Strait was about average. Similar variations in positive sea level pressure anomalies have continued, with the largest positive anomalies over the central Arctic in January, and over the Barents Sea in February.
This pattern is similar to that observed during the extreme negative Arctic Oscillation year of 2009/2010, when old ice was transported into the southern Beaufort and Chukchi seas where it then melted out during summer 2010, further depleting the Arctic of its store of old, thick ice.
Ice fracture
During the last couple of weeks of February, a broad area of sea ice has fractured off the coast of Alaska and Canada, extending from Ellesmere Island in the Canadian Arctic to Barrow, Alaska. This fracturing event appears to be related to a series of storms that moved across central Alaska starting on February 10, 2013, causing intense easterly winds along the coast and strong off-shore ice motion.* The large area of fractured ice is located in predominantly first-year ice, which is thinner and easier to fracture than thick, multiyear ice. Similar patterns were observed in early 2011 and 2008, but the 2013 fracturing is quite extensive. The animation (Figure 5) shows the progress of the fracturing, and the general strong rotation of the Beaufort Gyre ice motion pattern during late February. (See also this animation of the fracture from the AVHRR instrument, posted on the Arctic Sea Ice Blog.)
* Note: We originally attributed the fracturing event to a storm that passed over the North Pole, and stated “This fracturing event appears to be related to a storm that passed over the North Pole on February 8, 2013, creating strong off-shore ice motion.” We corrected this sentence after reexamining weather charts. The updated version now reads, “This fracturing event appears to be related to a series of storms that moved across central Alaska starting on February 10, 2013, causing intense easterly winds along the coast and strong off-shore ice motion.”
Click this link to see the video, Large crack in Arctic sea ice, February 2013
Antarctic sea ice extent continues above average
The Antarctic sea ice minimum extent appears to have passed, on February 20. Ice was quite extensive throughout the austral summer period. Monthly average sea ice extent for February 2013 was 3.83 million square kilometers (1.48 million square miles) and minimum daily sea ice extent for the Antarctic region was 3.68 million square kilometers (1.42 million square miles) on February 20. Unusual circulation patterns, likely resulting from higher-than-average pressure in the Bellingshausen Sea, pushed sea ice in the northwestern Weddell Sea far to the north, as we mentioned in our February post. NASA’s Earth Observatory posted this image of ice in the Weddell Sea as Image of the Day for March 1st, 2013. Extent was also well above average for the Ross Sea region relative to the entire 1979 to 2013 satellite record.
The Odden
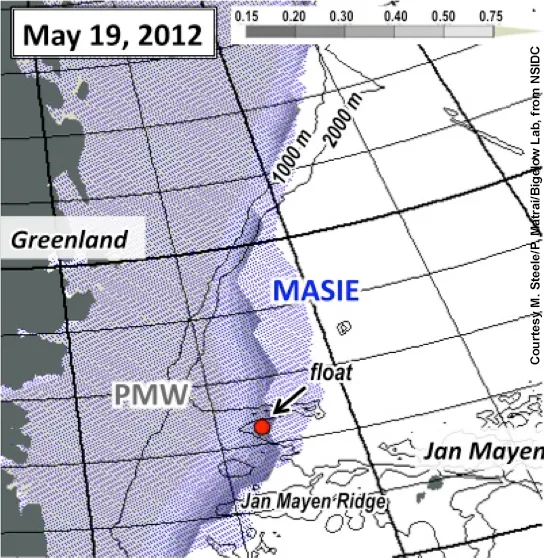
Within the East Greenland Sea, an ice tongue about 1,300 kilometers (807 miles) in length, referred to as “The Odden” (Norwegian word for headland), would regularly form during winter months eastwards from the main East Greenland ice edge. The Odden would form in winter because of an eastward flow of very cold ocean waters in the Jan Mayen current and may have played an important role in winter ocean convection as new ice would form. It would form as early as December and as late as April and was present during the 1980s, a few times in the 1990s, and very rarely since 2000. While the Odden rarely formed in last two decades, there is frequently a small extension of ice along the Jan Mayen Ridge, which may indicate that eastward flow of cold ocean water is still occurring.
