From August 10, 2007, through the end of the summer melt season, we posted updates on Arctic sea ice conditions, below. To view previous updates, scroll down to a particular date.
1 October, 2007: 2007 Arctic Sea Ice Minimum
Please see the NSIDC Press Release, Arctic Sea Ice Shatters All Previous Record Lows, for an analysis of this year's Arctic sea ice minimum and a synopsis of the information below.
17 October 2007
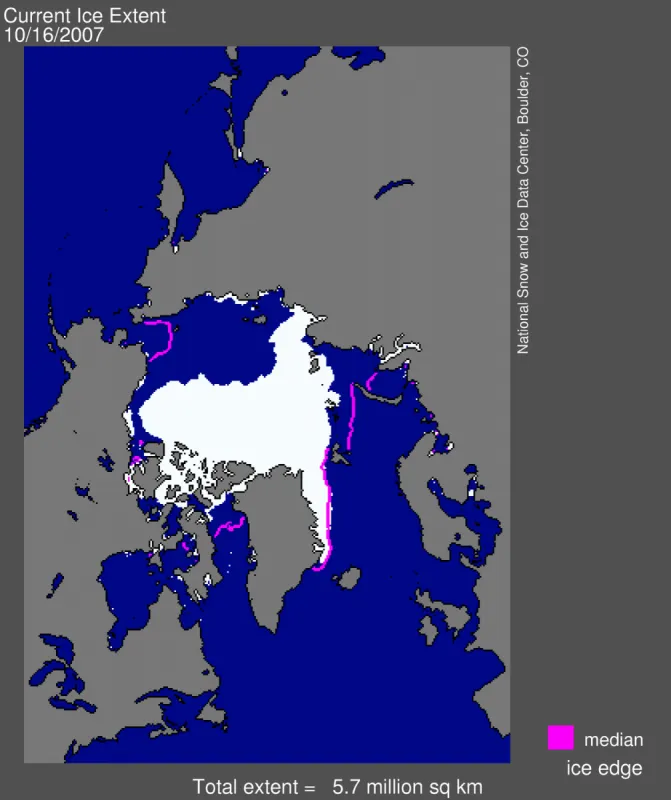
Overview of current sea ice conditions: Sea ice extent now stands at 5.65 million square kilometers (2.18 million square miles).
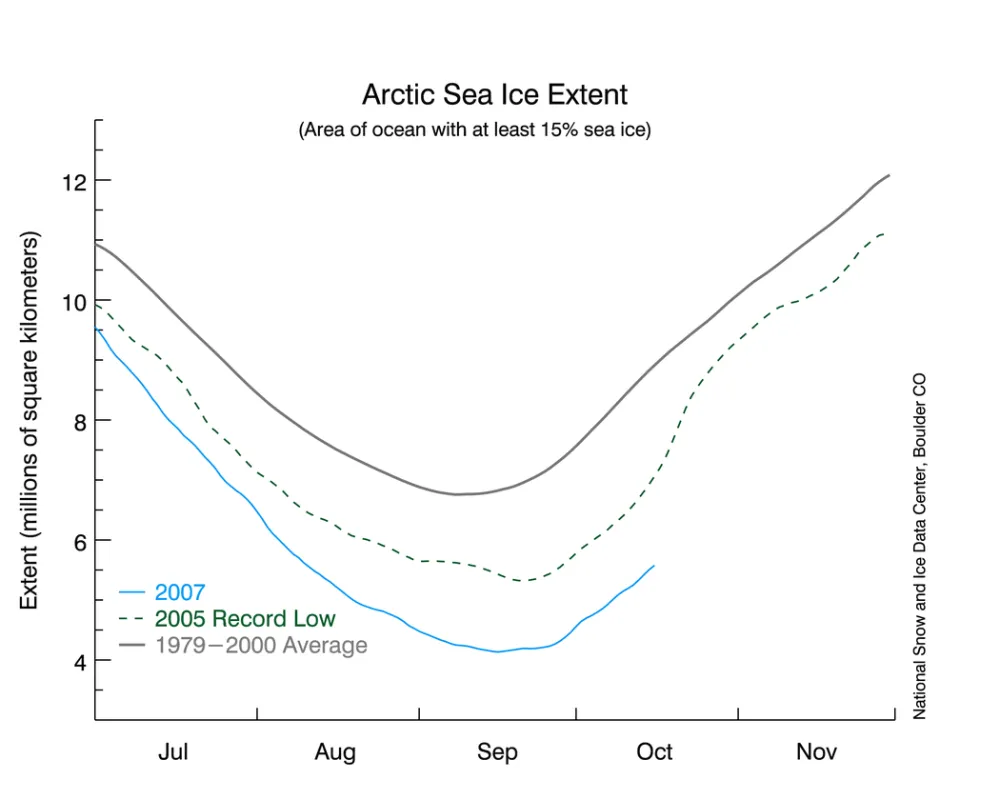
The figure below shows an updated map of sea ice extent for October 16, 2007; the magenta line shows the median October monthly extent based on data from 1979 to 2000. Sea ice extent is 5.65 million square kilometers (2.18 million square miles), an increase of 1.52 million square kilometers (590,000 square miles) since we reached the minimum extent of 4.13 million square kilometers (1.59 million square miles) on September 16.
While sea ice is again growing, we didn't actually get above the previous absolute minimum record extent, set on September 20–21, 2005, until October 14 of this year.
The Northwest Passage has re-frozen: After several weeks of nearly ice-free conditions in August and throughout September, the channels of the Northwest Passage now have sections covered with newly formed ice. Though some portions of the channels appear to still be fairly free of ice, all possible routes would now require ice-hardened vessels or icebreakers to transit.
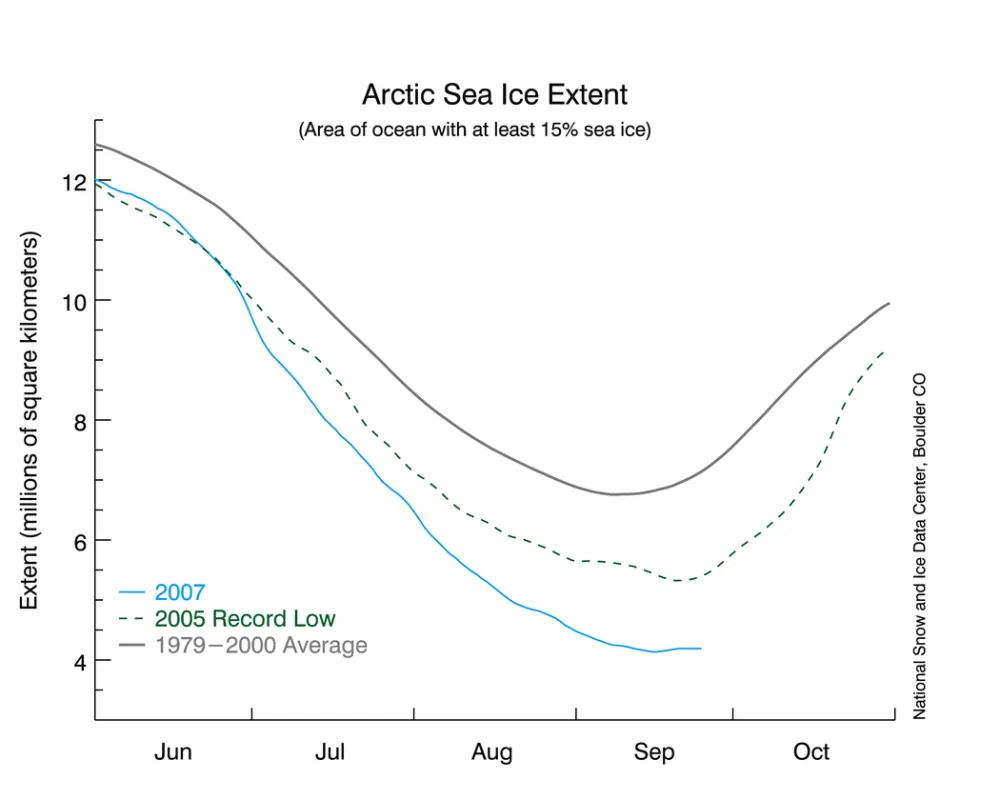
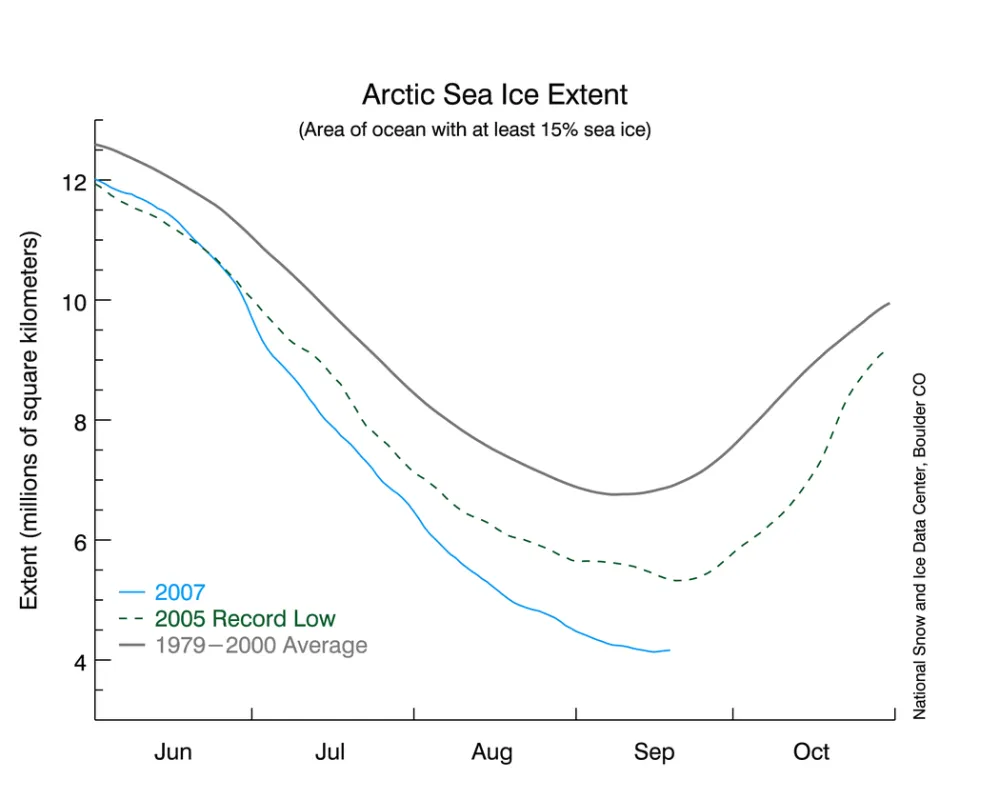
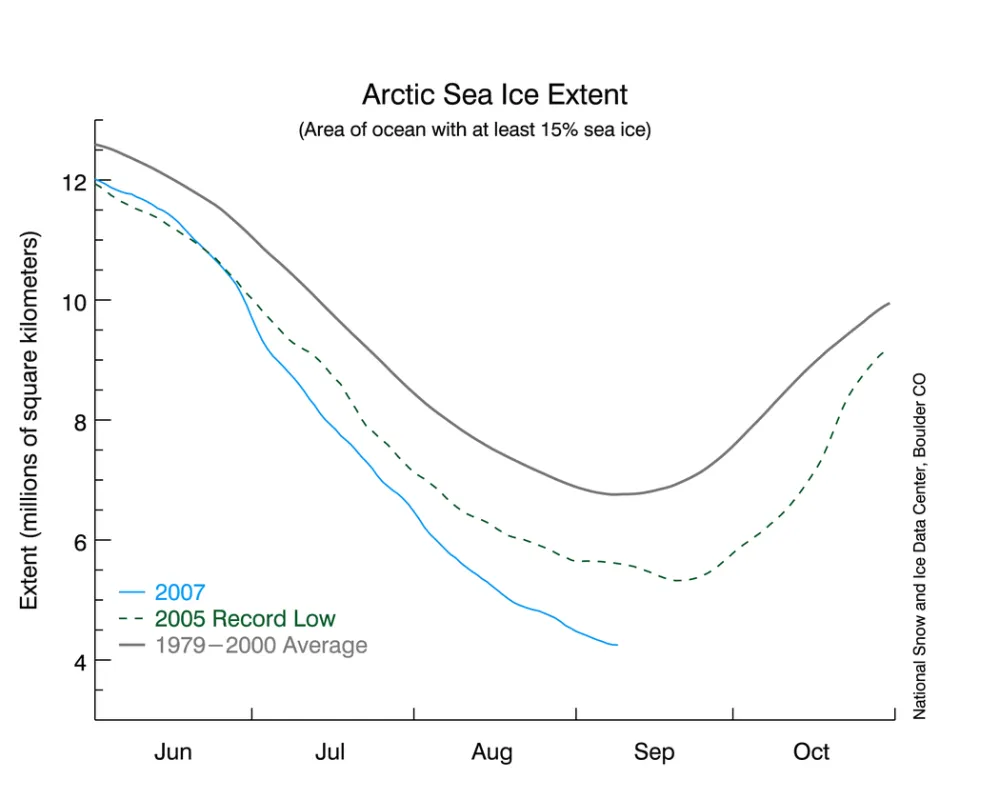
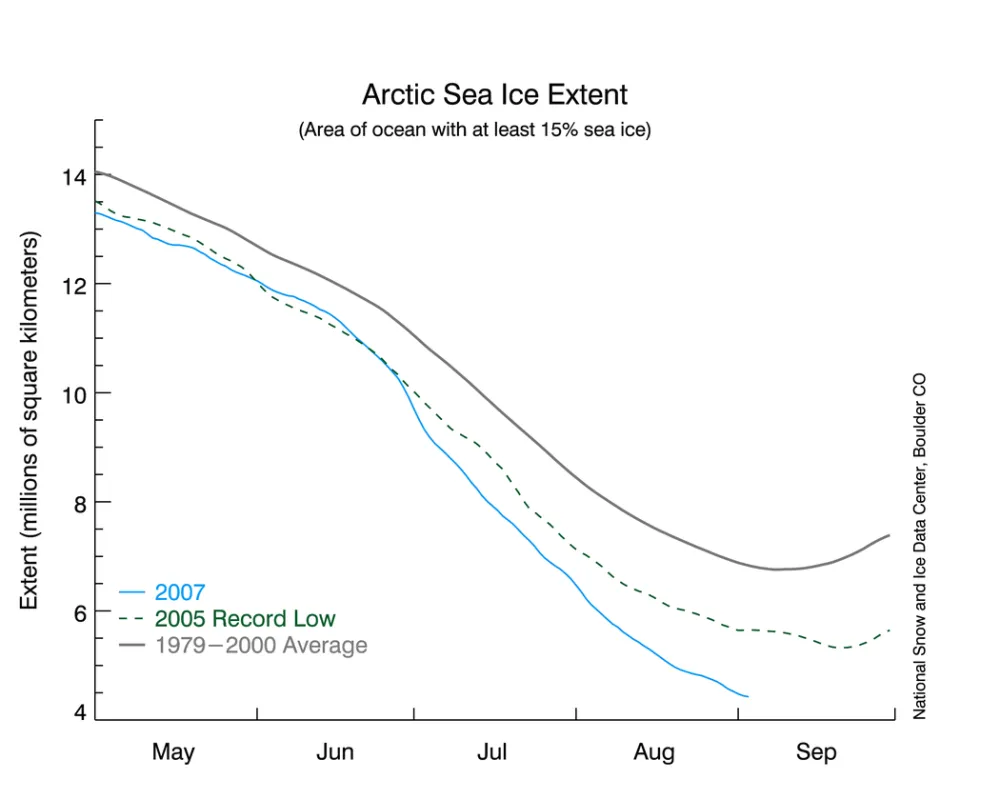
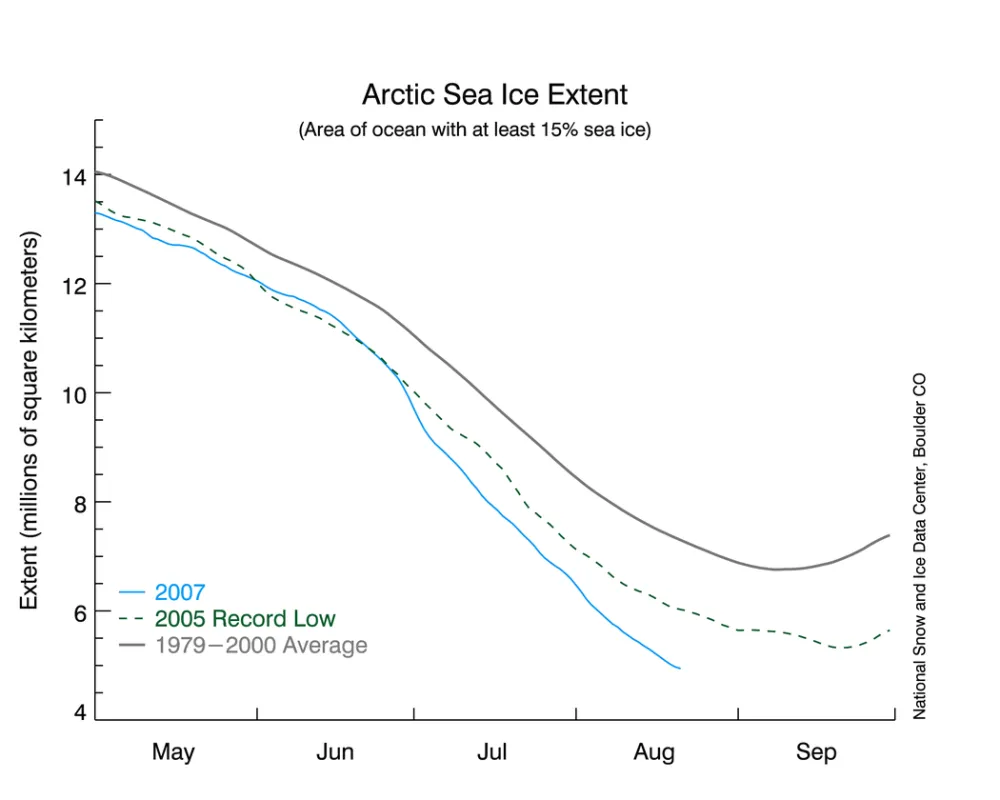
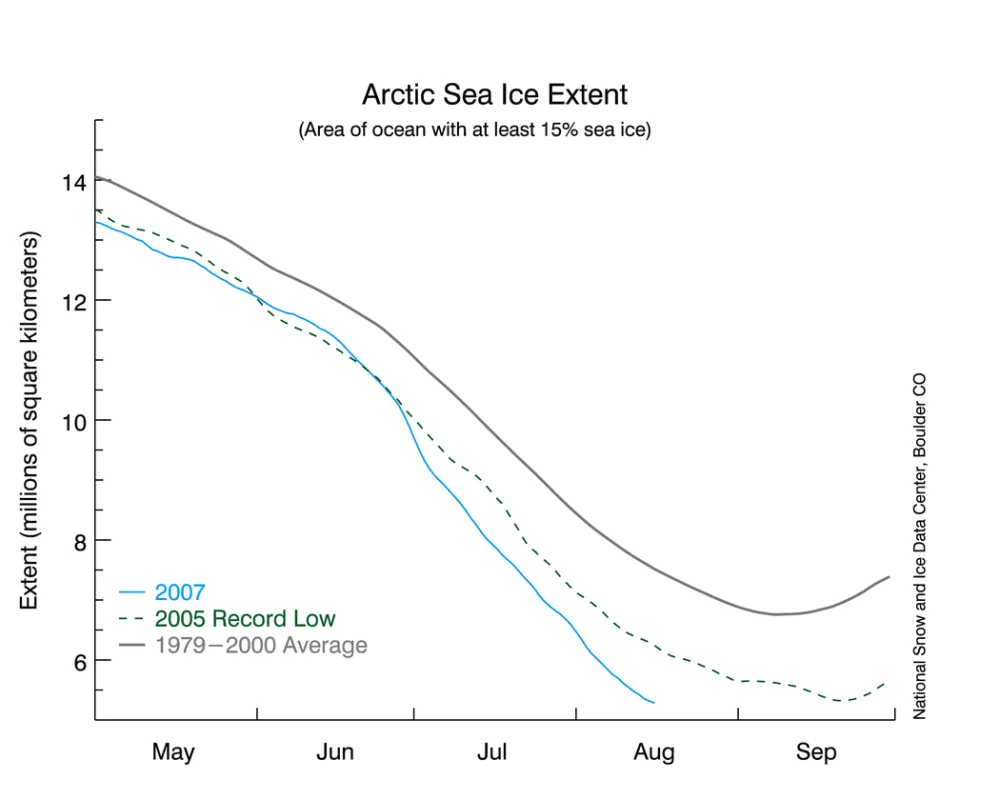
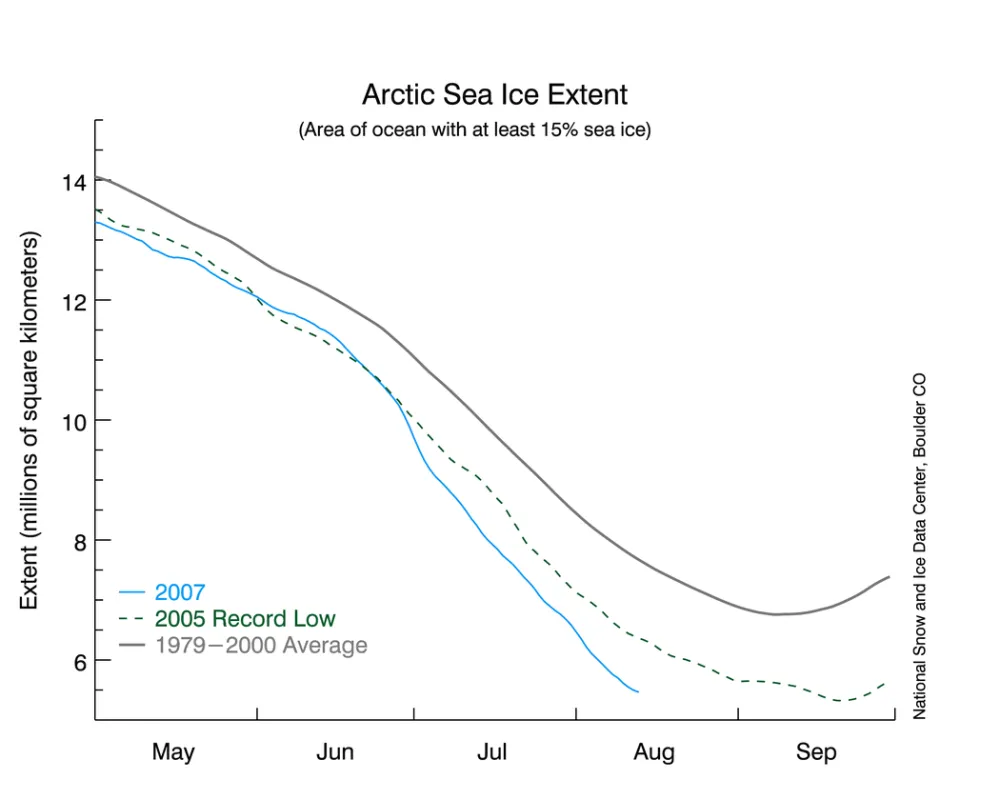
Current sea ice conditions in context: The figure above is the updated time series of daily sea ice extent for 2007, which can be compared to the time series for 2005 and to the 1979 to 2000 average. Freeze-up is continuing as the ice extent increases towards its maximum sometime during March of next year. However, because the Arctic lost so much ice this summer, exposed open-water areas have absorbed a lot of solar energy. Freeze-up is progressing slowly so far, as you can see in the graphic, because ice growth is delayed until the Arctic Ocean sufficiently cools in the gathering autumn darkness. Analysis of air temperature for September 25 through October 5 shows temperatures up to 10 degrees Celsius (18 degrees Fahrenheit) warmer than the long-term average in the Chukchi and East Siberian Seas, where the ocean is still ice-free.
The differences from climate norms for the previous century continue to increase, even though the 2007 melt season has ended and the ice has begun its seasonal recovery. As of October 16, the extent was 3.20 million square kilometers (1.23 million square miles) below the long-term average.
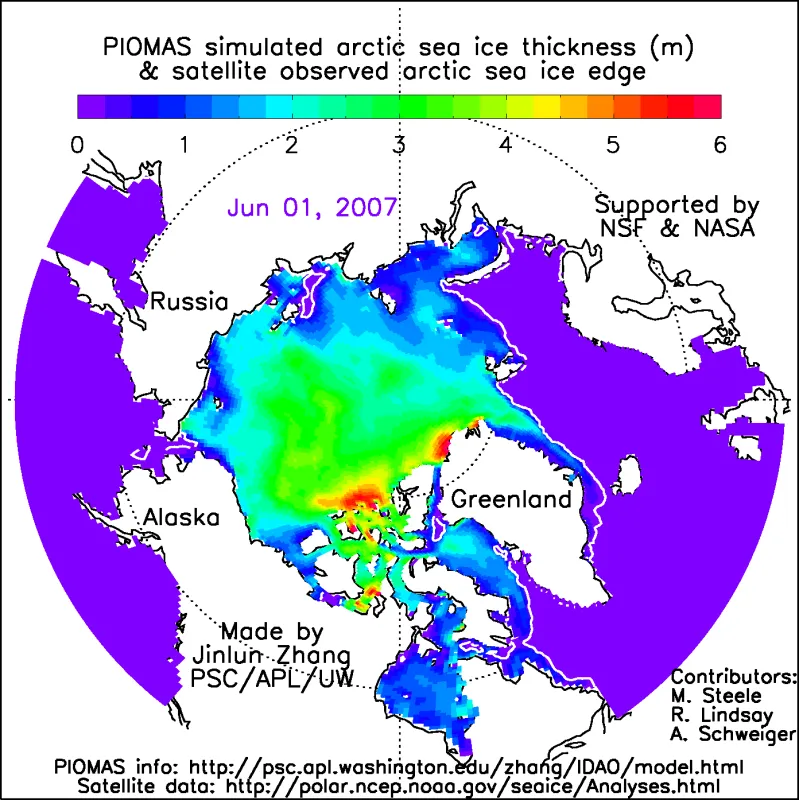
The Polar Science Center at the University of Washington’s Applied Physics Laboratory has created an animation of the 2007 sea ice thickness and extent (c) based on a combination of models and observed data. Click the image above to see the animation show the region of thick (greater than 3 meters [10 feet]) ice. In past decades, this thick ice spread across much of the central Arctic Basin. Recently, it has retreated to a narrow band along the northern Greenland and Canadian coasts, corroborating the ice-age animation in our August 22 entry.
26 September 2007
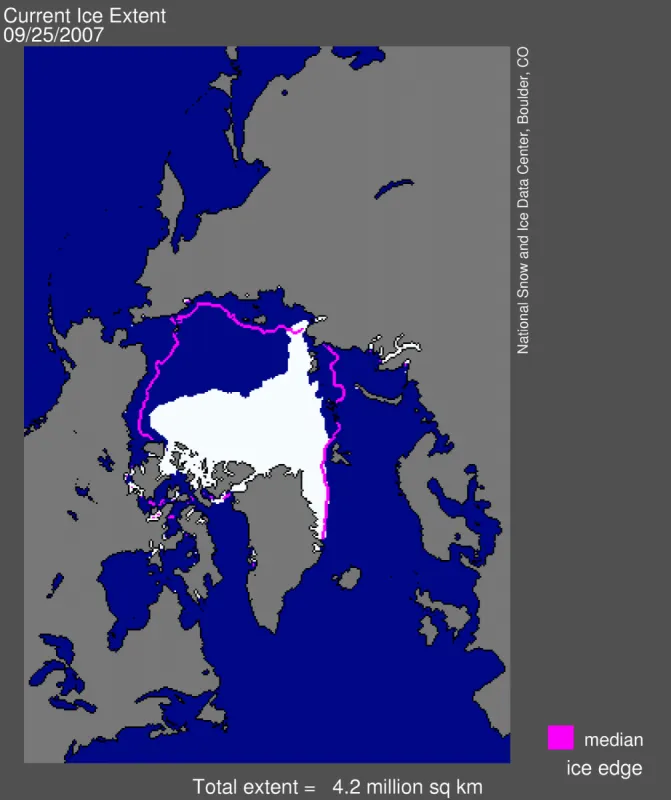
Overview of current sea ice conditions: Sea ice extent now stands at 4.20 million square kilometers (1.61 million square miles).
The figure above provides an updated map of sea ice extent for September 25, 2007; the magenta line shows the median September monthly extent based on data from 1979 to 2000. Sea ice extent is 4.20 million square kilometers (1.61 million square miles), an increase of 70,000 square kilometers (27,000 square miles) since the minimum extent of 4.13 million square kilometers (1.59 million square miles) on September 16. For more details on the minimum, please see the August 20 entry, below.
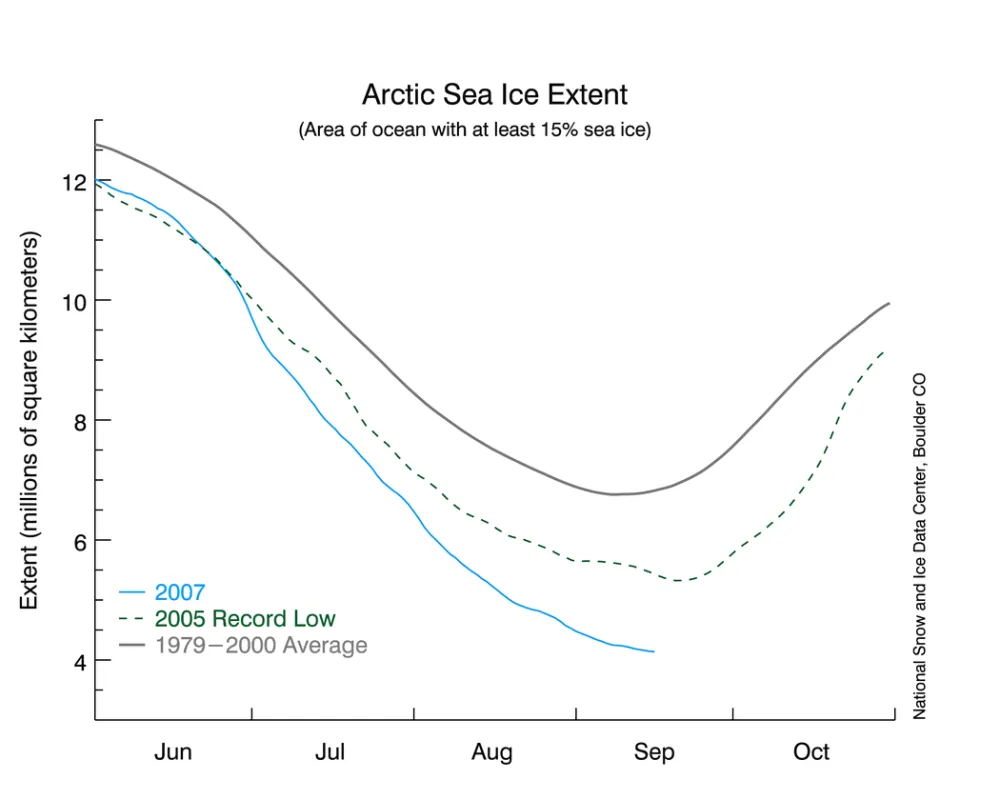
Current sea ice conditions in context: The figure above is the updated time series of daily sea ice extent for 2007, which can be compared to the time series for 2005 and to the 1979 to 2000 average.
Now that freeze-up has begun, ice extent will continue to increase until it reaches its maximum sometime during March of next year. However, because the Arctic lost so much ice this summer, exposed open-water areas have absorbed a lot of solar energy; freeze-up will begin slowly, as you can see in Figure 2. Once the ocean waters cool to the freezing temperature, the rate of ice growth will accelerate. Nonetheless, the extreme loss of this summer’s sea ice cover and the slow onset of freeze-up portends lower than normal ice extent throughout autumn and winter, and the ice that grows back is likely to be fairly thin.
Much of our discussion to date covers the period since 1979, when consistent and reliable satellite observations began. However, considerable data exist for earlier years. One good source has been compiled by the United Kingdom’s Hadley Centre for Climate Prediction and Research. Their analysis, based primarily on ship reports and aircraft reconnaissance, takes the record back to the turn of the 20th century. Although the data quality prior to the early 1950s is debatable, no year in this century-long record comes close to matching what we have seen in 2007. This record also points to a significant persistent downward trend in summer sea ice extent over at least the past fifty years. September 2007 sea ice extent is nearly 50% lower than during the 1950s and 1960s.
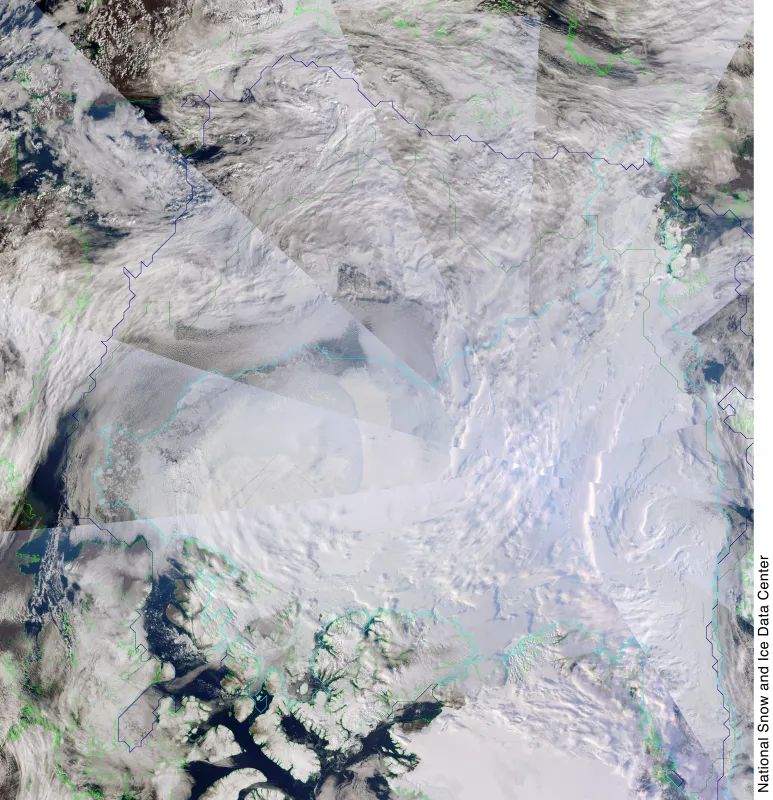
A closer look at sea ice extent around the minimum: The graphic above shows a composite image from the NASA Moderate Resolution Imaging Spectroradiometer (MODIS) sensor for September 15–16, 2007, the period when we reached this year's minimum. Despite some cloud cover, you can see the ice edge (turquoise line) in many areas. The Northwest Passage, in the lower left corner, was largely open; the sea ice has since begun to form in earnest in many of the channels. Green lines indicate land masses; the purple line indicates the long-term median sea ice extent, and the dashed green line indicates the September 2005 sea ice edge.
The reason you see cone-like shapes, with the tips coalescing at the Pole, is that the MODIS sensor moves in swaths over the Arctic, and we have stitched these images together to form a composite image.
For more information on the Northwest Passage ice conditions, see the Canadian Ice Service Web site. The United States National Ice Center also tracks sea ice; visit them at the U.S. National Ice Center website.
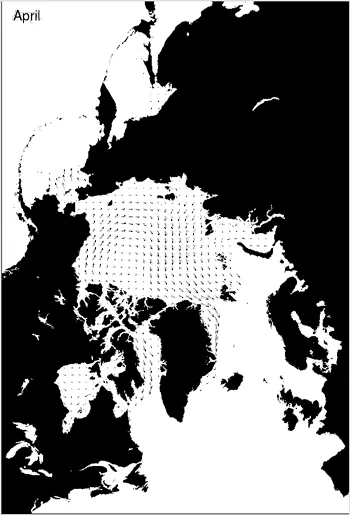
The role of sea ice drift: Another important aspect of this year’s extreme decline is the ice drift. As noted in earlier entries, persistent high pressure over the central Arctic Ocean led to fairly clear skies for the most of the summer, promoting melt. However, at the same time, the pattern of surface winds also led to an export of ice from the eastern Siberian side of the Arctic northward and westward. This is evident in Figure 4, which shows April through August monthly average ice motion calculated from NASA Advanced Microwave Scanning Radiometer (AMSR) imagery. It also helped push ice against the coast and offshore islands in Siberia, blocking the Northern Sea Route throughout the summer. Similar conditions in earlier years contributed to the loss of old ice that we discussed in our August 22 entry.
Impacts on people and wildlife: We cannot yet quantify the impacts of this year’s record low ice extent on indigenous communities and polar wildlife. However, this summer was likely difficult for polar bears and other wildlife that rely on the sea ice. Inhabitants of Arctic coastal communities have had to adjust to a lack of coastal ice for much of the summer, which has posed a significant challenge to their traditional methods of hunting and travel. While this year was particularly extreme, we are seeing a bold exclamation point on a trend of ice loss that has been ongoing for at least the past fifty years.
20 September 2007
Overview of current sea ice conditions: Sea ice extent now stands at 4.18 million square kilometers (1.61 million square miles). This represents an increase of 50,000 square kilometers (19,000 square miles) compared to the value of 4.13 million square kilometers (1.59 million square miles) five-day running mean extent, observed on September 16, which appears to be the 2007 minimum.
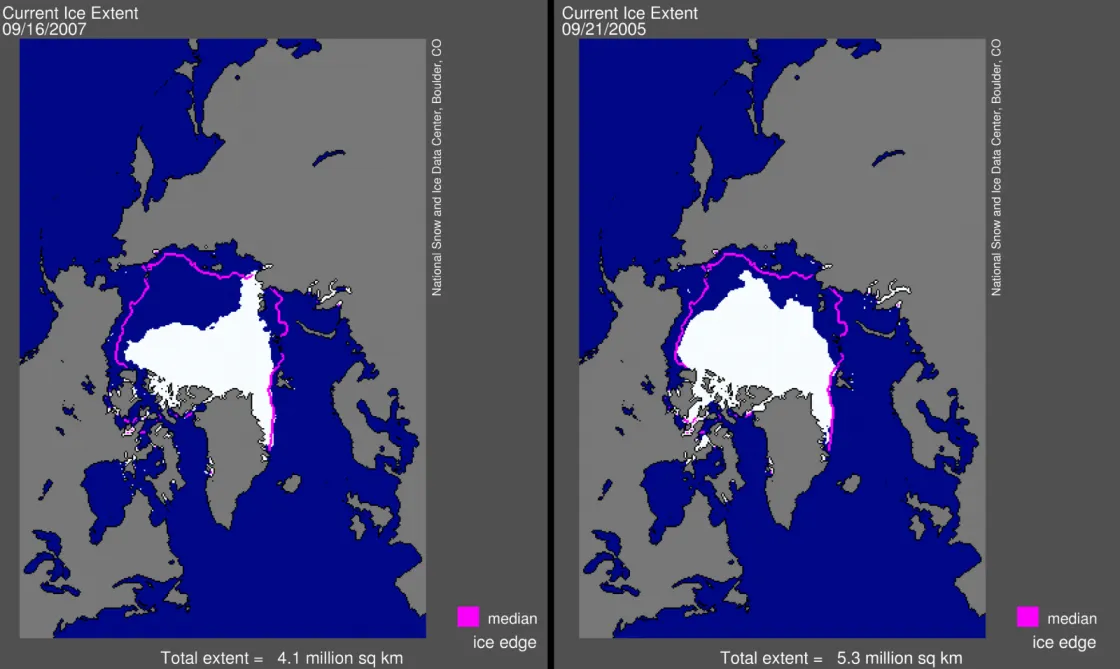
Sea ice conditions at the annual minimum on September 16, 2007: The figure above compares the five-day mean sea ice extent on September 16, 2007, this year’s apparent minimum, with minimum sea ice extent on September 20–21, 2005, the previous record low. The magenta line indicates the mean September extent based on data from 1979 to 2000. The apparent five-day 2007 minimum was 4.13 million square kilometers (1.59 million square miles), compared to 5.32 million square kilometers (2.05 million square miles) in 2005.
The long-term average minimum, based on averaging data from 1979 to 2000, is 6.74 million square kilometers (2.60 million square miles) and occurs on September 12. Compared to this average, five-day mean ice extent for September 16, 2007, was lower by 2.61 million square kilometers (one million square miles), an area approximately equal to the size of Alaska and Texas combined, or the size of ten United Kingdoms.
The minimum for 2007 shatters the previous five-day minimum set on September 20–21, 2005, by 1.19 million square kilometers (460,000 square miles), roughly the size of Texas and California combined, or nearly five United Kingdoms.
2007 sea ice minimum in context: The figure above is the updated time series of daily sea ice extent for 2007, which can be compared to the time series for 2005 and to the 1979 to 2000 average. The lowest point on each year’s time series indicates the annual absolute minimum. With the onset of autumn and lower temperatures each year, sea ice extent begins to increase. As winter progresses, the sea ice “recovers,” usually reaching its maximum in March before the melting cycle begins again.
A word of caution on calling the minimum: Determining with certainty when the minimum has occurred is difficult until the melt season has decisively ended. For example, in 2005, the time series began to level out in early September, prompting speculation that we had reached the minimum. However, the graphic illustrates, the sea ice contracted later in the season, again reducing sea ice extent and causing a further drop in the absolute minimum.
We mention this now because the natural variability of the climate system has frequently been known to trick human efforts at forecasting the future. It is still possible that ice extent could fall again, slightly, because of either further melting or a contraction in the area of the pack due to the motion of the ice. However, we have now seen five days of little change or slight gains in extent, so that seems unlikely at this time. Due to the variability of sea ice at this time of year, the National Snow and Ice Data Center determines the minimum using a five-day running mean value.
At the end of the melt season, in the first few days of October, we will be issuing a full analysis of the 2007 melt season, including final numbers and a discussion of the causes and effects of this year’s stunning record low. At that time, we will also know what the monthly September sea ice extent was in 2007—the measure scientists often rely on for the most accurate analysis.
A final note: The Northwest Passage is still open but is starting to refreeze. The Northeast Passage (the Northern Sea Route) along the coast of Siberia, is still closed by a narrow band of sea ice.
17 September 2007
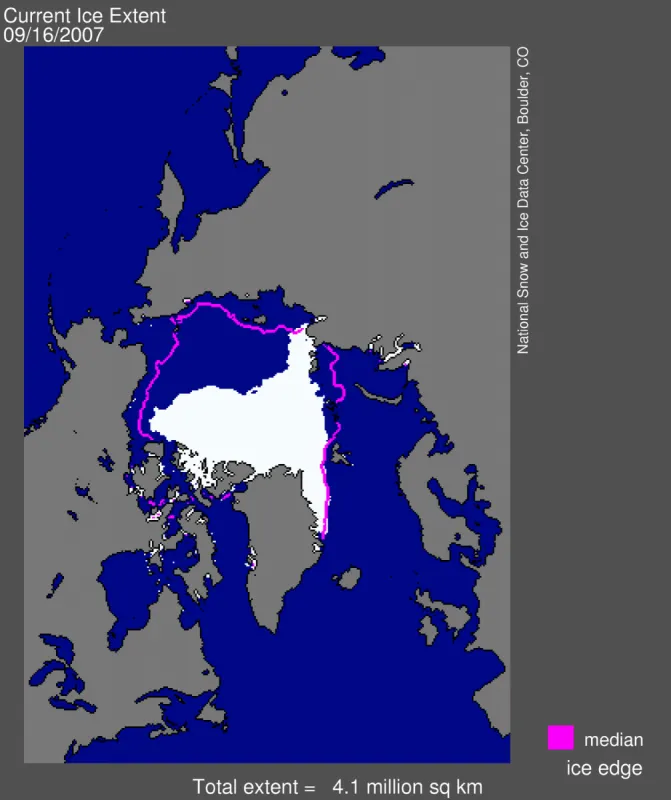
Overview of current sea ice conditions: Sea ice extent now stands at 4.14 million square kilometers (1.63 million square miles).
Current sea ice conditions: September 16, 2007 The figure above provides the updated map of sea ice extent for September 16, 2007. Sea ice extent now stands at 4.14 million square kilometers (1.63 million square miles). The magenta line shows the median September monthly extent based on data from 1979 to 2000. The main, deep channel of the Northwest Passage (Lancaster Sound to M'Clure Strait) has been open, or nearly ice-free, for about five weeks (since August 11, approximately). Of note is the northernmost ice edge ever recorded, at 85.5 degrees North, near the 160 degrees east longitude line.
Sea ice is still declining, although the rate is very slow at present. Sea ice extent at this time of year can vary from day to day, as regions within the Arctic have small episodes of melt, freeze, or wind movement of the ice, just before the strong autumn cooling. As of September 16, sea ice extent was 4.14 million square kilometers (1.59 million square miles), surpassing the previous one-day record of September 20–21, 2005, by more than 1.2 million square kilometers (461,000 square miles).
Due to the variability of sea ice at this time of year, the National Snow and Ice Data Center determines the minimum using a five-day running mean value. This value continues to decline as of our information on September 17. In past years, the minimum has occurred as early as September 4, and as late as September 28. In recent years, there has been a trend towards later final minima dates.
Current sea ice conditions in context The graphic above is the updated time series of daily ice extent for 2007, which can be compared to the time series for 2005 and to the 1979 to 2000 average. Compared to conditions cited in our last entry on September 9, we have lost an additional 100,000 square kilometers (38,000 square miles) of ice.
10 September 2007
Overview of current sea ice conditions: Sea ice extent continues to decline, and is now at 4.24 million square kilometers (1.63 million square miles), falling yet further below the previous record absolute minimum of 5.32 million square kilometers (2.05 million square miles) that occurred on September 20–21, 2005.
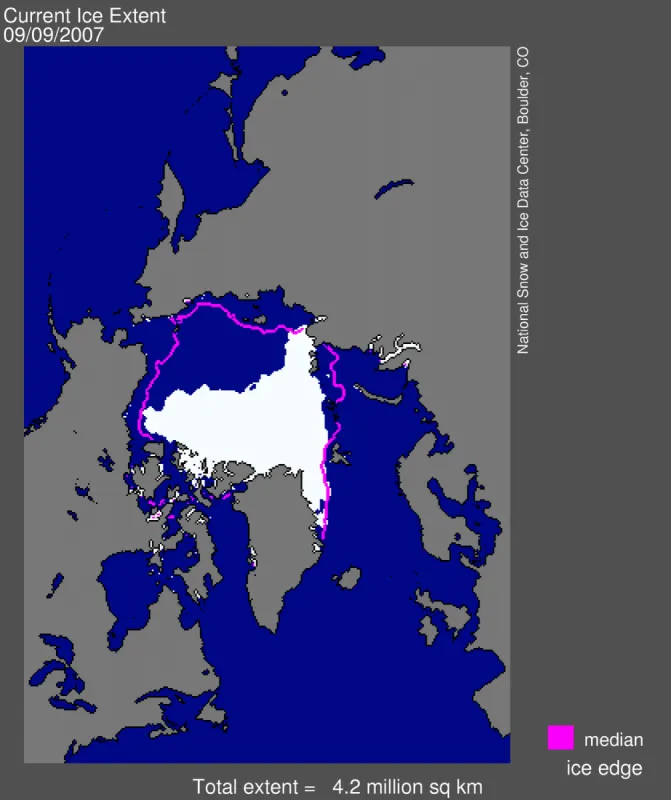
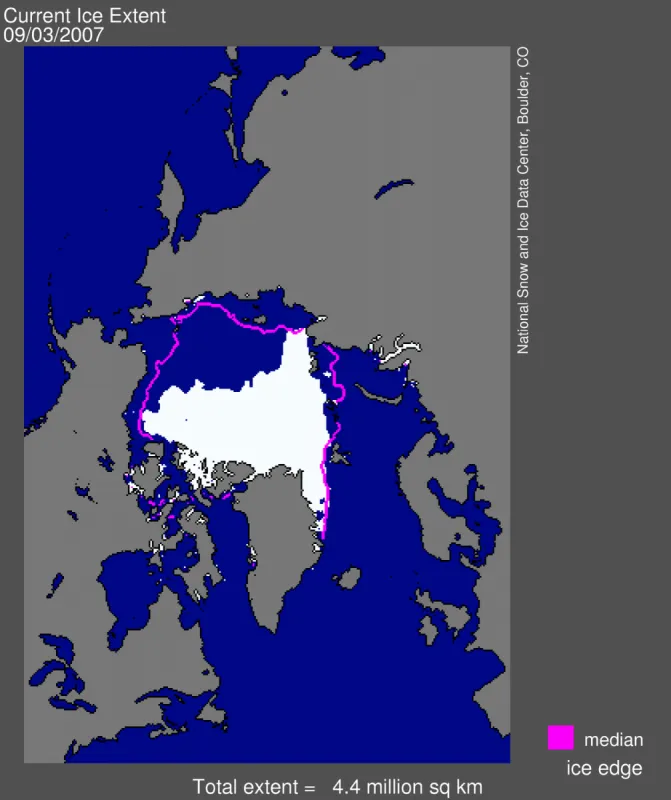
The graphic above is an updated map of sea ice extent for September 9, 2007. Sea ice extent now stands at 4.24 million square kilometers (1.63 million square miles). The magenta line shows the median September monthly extent based on data from 1979 to 2000.
The Northwest Passage is still open. The Northeast Passage, along the coast of Siberia, is still closed by a narrow band of sea ice.
Current sea ice conditions in context The updated time series (above) of daily ice extent for 2007, which can be compared to the time series for 2005 and to the 1979-2000 average. Compared to conditions cited in our last entry on September 3, we have lost an additional 180,000 square kilometers (69,000 square miles) of ice, an area roughly the size of Florida. However, the rate of loss from day to day has greatly slowed.
The absolute minimum for 2007 could occur any day now. While on average, based on data from 1979 to 2000, this minimum has occurred around September 13, it has occurred as late as September 25.
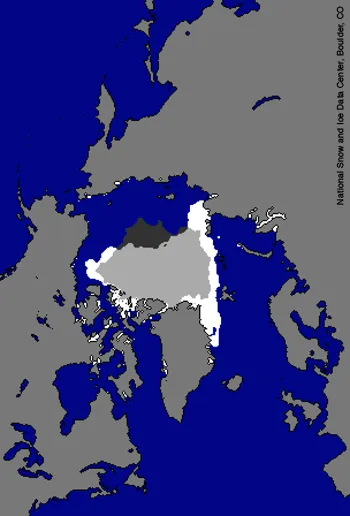
Yesterday's sea ice extent compared to perennial sea ice The image below further illustrates the significance of this year’s decline in sea ice. In this figure, we overlay two areas. Gray areas within the Arctic Ocean indicate where sea ice was present every day of every year from 1979 through spring 2007. Yesterday’s sea ice is in white, and the overlap areas are in light gray. The dark gray color represents the region that is ice-free for the first time in the satellite record.
What does this figure really tell us? It tells us that a large area is, for the first time since the satellite record began, not covered by sea ice.
The amount and location of summer sea ice varies from year to year, so even after twenty-eight years it would not be surprising to have some small areas that are newly ice-free each year. However, this year the first-time ice-free area is extremely large—roughly the size of the state of California.
Continued high pressure and warmth As outlined in the August 14 and August 22 reports, the atmospheric pressure pattern over the Arctic has been unusual this summer. Sea-level pressure over the Arctic Ocean has tended to be fairly high, while pressure has been fairly low over northeastern Siberia. This has given rise to a pattern of winds bringing in warm air from the south over the coastal seas of eastern Siberian, fostering strong melt and tending to push ice from the coast into the central Arctic Ocean. Melt has been further enhanced by the fairly clear skies under the high-pressure area, known to climatologists as an “anticyclone."
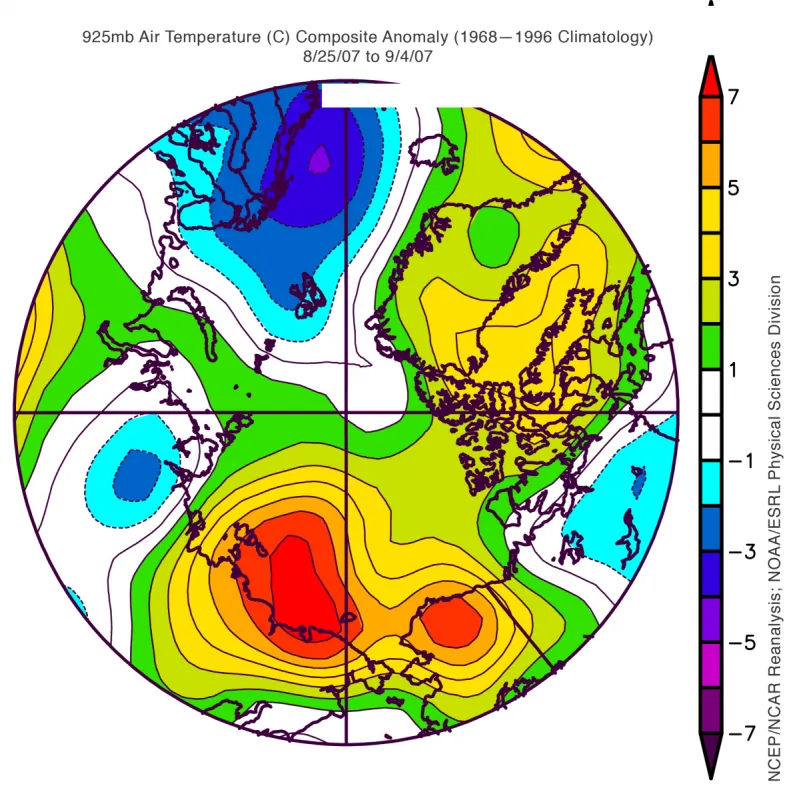
This atmospheric pattern has persisted through late August and early September. The graphic below shows temperature anomalies at the 925 millibar pressure level (roughly 2,500 feet) averaged for August 25 through September 4. Positive anomalies cover much of the Arctic Ocean, but are especially strong (up to 7 degrees Celsius, or 13 degrees Fahrenheit) along the Siberian coast. While consistent with the pattern of winds bringing warm air into the region, we are probably also seeing a second and quite different effect.
Continued high pressure and warmth As outlined in the August 14 and August 22 reports, the atmospheric pressure pattern over the Arctic has been unusual this summer. Sea-level pressure over the Arctic Ocean has tended to be fairly high, while pressure has been fairly low over northeastern Siberia. This has given rise to a pattern of winds bringing in warm air from the south over the coastal seas of eastern Siberian, fostering strong melt and tending to push ice from the coast into the central Arctic Ocean. Melt has been further enhanced by the fairly clear skies under the high-pressure area, known to climatologists as an “anticyclone."
This atmospheric pattern has persisted through late August and early September. Figure 4 shows temperature anomalies at the 925 millibar pressure level (roughly 2,500 feet) averaged for August 25 through September 4. Positive anomalies cover much of the Arctic Ocean, but are especially strong (up to 7 degrees Celsius, or 13 degrees Fahrenheit) along the Siberian coast. While consistent with the pattern of winds bringing warm air into the region, we are probably also seeing a second and quite different effect.
Effects of open water on air temperature What is this second effect? Because oceans are so dark compared to sea ice, the immense open water areas north of Siberia absorbed a great deal of the sun’s energy through summer, hence heating the upper ocean. As the sun begins to set in autumn, this heat stored in the ocean starts to be released back to the atmosphere, which increases air temperatures. Hence, the anomalous lack of sea ice is itself partly responsible for the unusually high temperatures. We expect this effect to become more prominent in the coming weeks as the ocean releases more heat.
Climate models have long told us that as greenhouse warming takes hold, rises in surface temperature over the Arctic Ocean will be especially large compared the rest of the Northern Hemisphere. A key part of this so-called "arctic amplification" is the growing impact through time of the very process just described. Namely, with increasingly less sea ice at the end of summer as the years pass, the heat transfer from the ocean to the atmosphere in autumn also grows.
Impacts of ocean circulation In the August 22 report, we explained that another part of the 2007 story is "memory" of the sea ice to changes that have been unfolding over the past few decades. Our focus there was on the apparent transition to younger, thinner ice since the late 1970. As discussed, factors contributing to this thinning involve a general rise in air temperatures, and changing winds that have transported fairly thick ice out of the Arctic Ocean into the North Atlantic. An issue that we haven't addressed, yet, is changes in ocean circulation.
One prominent researcher, Igor Polyakov at the University of Fairbanks, Alaska, points out that pulses of unusually warm water have been entering the Arctic Ocean from the Atlantic, which several years later are seen in the ocean north of Siberia. These pulses of water are helping to heat the upper Arctic Ocean, contributing to summer ice melt and helping to reduce winter ice growth. Another scientist, Koji Shimada of the Japan Agency for Marine–Earth Science and Technology, reports evidence of changes in ocean circulation in the Pacific side of the Arctic Ocean. Through a complex interaction with declining sea ice, warm water entering the Arctic Ocean through Bering Strait in summer is being shunted from the Alaskan coast into the Arctic Ocean, where it fosters further ice loss.
Many questions still remain to be answered, but these changes in ocean circulation may be important keys for understanding the observed loss of Arctic sea ice.
4 September 2007
Overview of current sea ice conditions Sea ice extent continues to decline, and is now at 4.42 million square kilometers (1.70 million square miles), falling yet further below the record absolute minimum of 5.32 million square kilometers (2.05 million square miles) that occurred on September 20–21, 2005.
The graphic above provides the updated map of sea ice extent for September 3, 2007; the magenta line shows the median September extent based on data from 1979 to 2000. Sea ice extent now stands at 4.42 million square kilometers (1.70 million square miles).
Current sea ice conditions in context The updated time series (above) of daily ice extent for 2007, which can be compared to the time series for 2005 and to the 1979 to 2000 average. Compared to conditions cited in our last entry, we have lost an additional 360,000 square kilometers (138,000 square miles) of ice, an area larger than the size of the state of New Mexico. We noted in our last entry that the daily rate of ice loss was starting to slow; the loss rate has increased again, as Figure 2 shows.
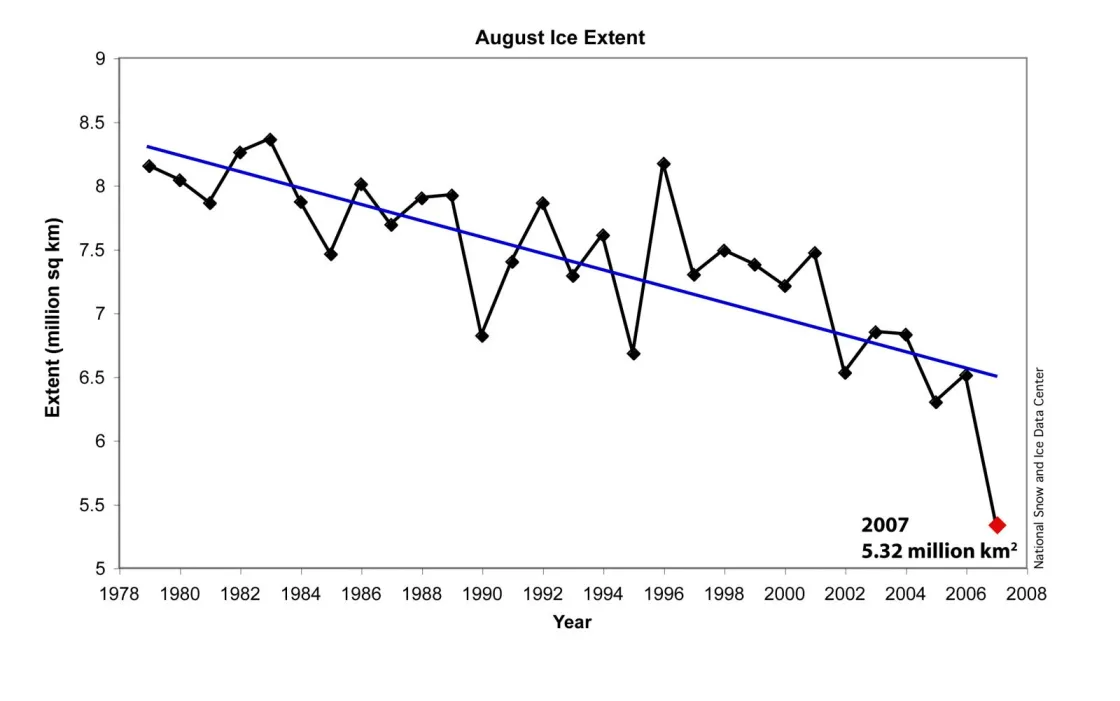
August in review Many scientists prefer to look at monthly average sea ice extent, rather than daily extent values, because looking at an average of many numbers lends more confidence to the overall picture. Put another way, an average is more reliable than a single daily value.
Figure 3 provides a time-series of monthly average sea ice extent from August 1979 to August 2007. The low ice extent for August 2007 stands out sharply compared to all previous Augusts. The August 2007 monthly average extent was 5.32 million square kilometers (2.05 million square miles), falling well below August 2005 extent, which was 6.30 million square kilometers (2.42 million square miles). Additionally, August 2007 ice extent is 31% below the long-term average of 7.67 million square kilometers (2.95 million square miles).
Even more stunning is that the August 2007 monthly average is the lowest extent in the satellite record for any month, including any previous September, which is typically the lowest month each year. September 2005, the previous record, had a monthly mean extent of 5.56 million square kilometers (2.14 million square miles).
August 2007 sea ice extent was lower than September 2005 extent by 240,000 square kilometers (92,000 square miles).
Northwest Passage update Another notable aspect of August 2007 was the opening of the Northwest Passage (see red line in graphic above and August 22 entry below). During August 2007, the passage was the most navigable that people have seen since monitoring began. The Northeast Passage, along the Russian coast, is still blocked by fairly heavy ice conditions north of the Taymyr Peninsula.
Might the Northeast Passage open in the next few weeks? We will be monitoring the situation.
28 August 2007
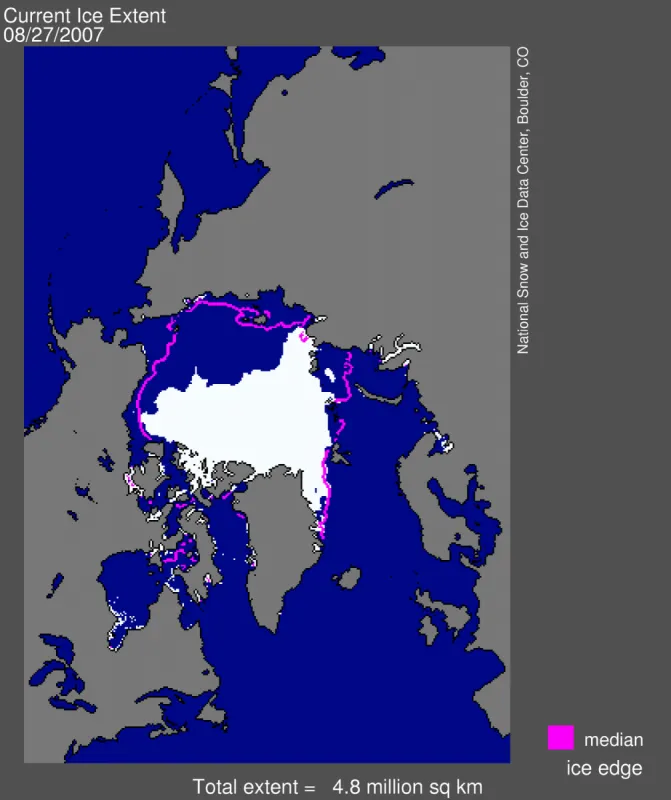
Overview of current sea ice conditions Sea ice extent continues to decline, and is now at 4.78 million square kilometers (1.84 million square miles), falling yet further below the record absolute minimum of 5.32 million square kilometers (2.05 million square miles) that occurred on September 20–21, 2005.
The graphic above provides the updated map of sea ice extent for August 27, 2007. Sea ice extent now stands at 4.78 million square kilometers (1.84 million square miles). The magenta line shows the median August extent based on data from 1979 to 2000.
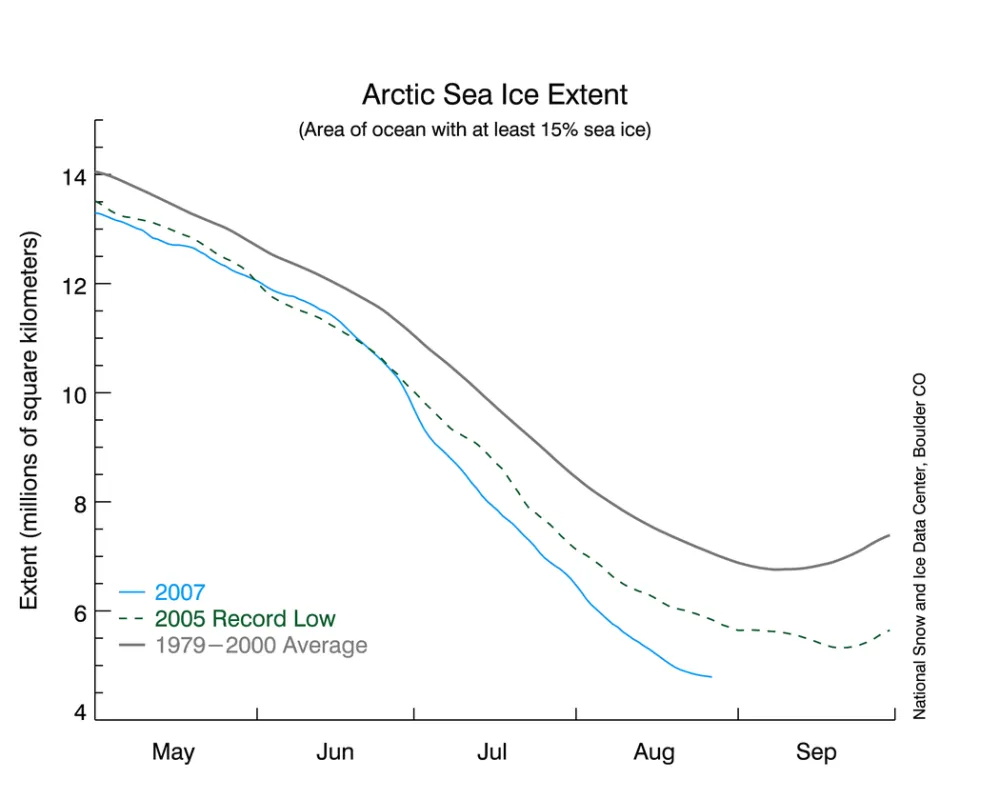
Current sea ice conditions in context The updated time series (above) of daily ice extent for 2007, which can be compared to the time series for 2005 and to the 1979 to 2000 average. Compared to conditions described in our last entry on August 21, we have lost an additional 140,000 square kilometers (54,000 square miles) of ice, an area roughly the size of the state of New York.
The rate of loss from day to day has started to slow. As the sun gets lower in the sky with the coming of autumn, the amount of solar energy reaching the surface declines and the Arctic begins to cool. Nevertheless, another two to three weeks of further ice loss is likely.
A bit of detail on how we measure sea ice All of our discussion, so far, has focused on ice extent. To revisit that concept: Ice extent is the region of the Arctic Ocean covered by sea ice with a concentration of at least 15%. The microwave sensor used to collect sea ice data sees Earth's surface in discrete regions, called “grid cells” of roughly twenty-five kilometers (sixteen miles) on a side. Within a given grid cell, one may have a mixture of sea ice and open ocean water, which varies between 0% (all water, no ice) to 100% (completely ice covered). In the calculation of ice extent, we simply sum up the area of grid cells that have an ice concentration of at least 15%.
Importance of sea ice concentration Ice concentration can also tell us about changes taking place within the icepack. For example, take a look at the graphic above, which compares maps of sea ice for the same day, August 27, in both 2007 and 2005. First, you can see that the extent of the ice--anywhere in which you see white grading to blue--is clearly lower. You can also see that the ice edge has pulled further back from the shore of north Siberia, this year.
However, when you look at the concentration of the sea ice, with white indicating high concentration, grading to the dark blue of open water, you see an additional level of detail. You see that within the pack ice, ice concentration this year is much lower throughout much of the Arctic Ocean than it was in 2005, especially near the pole. In areas with low ice concentration, dark open water between ice floes absorbs more solar radiation, promoting further melt. These areas are hence susceptible to additional melting over the next few weeks.
Ice area In light of the the importance of ice concentration within the pack, another way to analyze the health of the sea ice is to look at a slightly different measurement: sea ice area. Sea ice area is a way of figuring in ice concentration over the entire Arctic. To determine the total ice area, we multiply each twenty-five- by twenty-five-kilometer (sixteen-mile by sixteen-mile) grid cell by its ice concentration. For example:
50% ice concentration x (25 kilometer x 25 kilometer grid cell) = 312.5 square kilometers of sea ice area
After making the calculation for all grid cells that contain at least 15% ice concentration, we add up the results. The number we obtain is the ice area for the Arctic. The total ice area numbers for August 27 are 3.17 million square kilometers (1.22 million square miles) in 2007 compared to 4.33 million square kilometers (1.66 million square miles) in 2005. In terms of ice area, sea ice cover in 2007 looks even a bit worse than sea ice extent. So, you might wonder, "Area seems like a more intuitive measurement. Why do scientists generally talk about ice extent instead of ice area?"
The answer is that scientists are cautious about summertime values of ice concentration and area. To the sensor, surface melt appears to be open water rather than water on top of sea ice. So, while reliable for most of the year, the microwave sensor is prone to underestimating the actual ice concentration and area when the surface is melting. One way scientists resolve uncertainty about ice extent and ice area is to compare measurements from the microwave sensor with measurements from other satellites. For example, on a clear day the Moderate Resolution Imaging Spectroradiometer (MODIS) can "see" sea ice. Take a look at Figure 3 and compare it to the MODIS image in our August 22 entry, which shows the region north of Alaska. Where the microwave sensor shows low concentration, the MODIS image shows ice floes and open water. So in this case, the MODIS image confirms the microwave sensor's finding of low ice concentration north of Alaska.
In conclusion, while sea ice extent is already very low in 2007, the decline in sea ice area also tells us that the remaining icepack is in poor shape.
22 August 2007
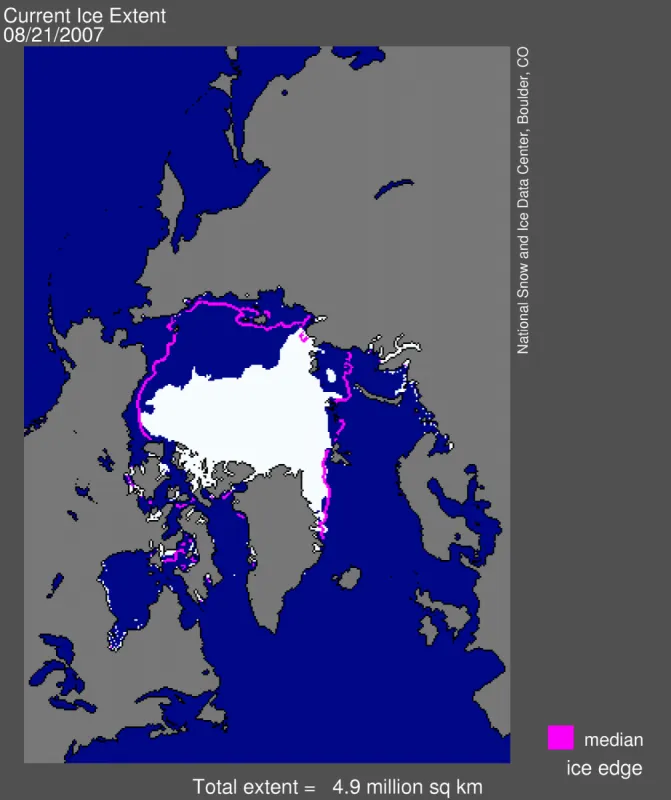
Overview of current sea ice conditions Sea ice extent continues to decline; it is currently tracking at 4.92 million square kilometers (1.89 million square miles), below the 2005 record absolute minimum of 5.32 million square kilometers (2.05 million square miles).
The graphic above is a map of sea ice extent for August 21, 2007. Sea ice extent now stands at 4.92 million square kilometers (1.89 million square miles). The magenta line shows the median August sea ice extent based on data from 1979 to 2000.
Current sea ice conditions in context The updated time series (above) of daily sea ice extent for 2007, 2005, and the 1979 to 2000 average. As mentioned above, sea ice extent on August 21 was 4.92 million square kilometers (1.89 million square miles). Compared to conditions cited in our August 17 update, we have lost an additional 340,000 square kilometers (131,000 square miles) of ice, an area larger than the the state of New Mexico. Ice extent is now well below the previous lowest absolute minimum extent of 5.32 million square kilometers (2.05 million square miles) recorded on September 20–21 of 2005, and there is likely several weeks of further melt ahead of us.
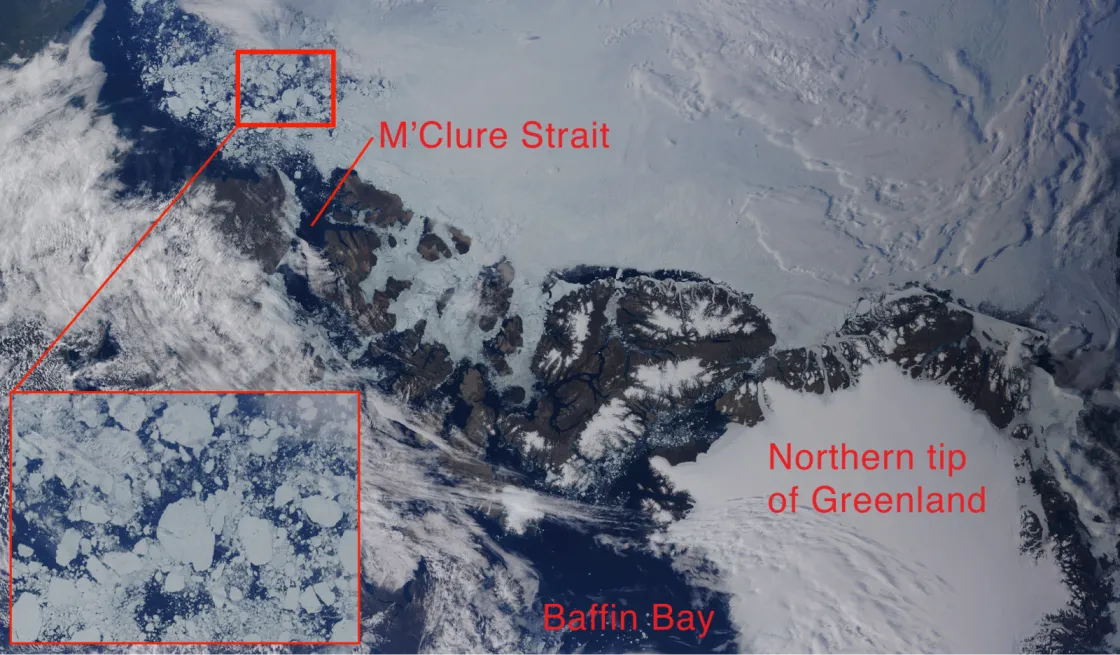
The opening of the Northwest Passage Of particular note is imminent opening of the fabled Northwest Passage through the channels of the Canadian Arctic Archipelago. This shortcut between the Atlantic and Pacific oceans was first navigated by Roald Amundsen in the early 1900s. It took his group over two years of arduous and dangerous navigation through narrow lanes of open water amongst thick, compact ice. Analysts at the Canadian Ice Service and the U.S. National Ice Center confirm that the passage is almost completely clear and that the region is more open than it has ever been since the advent of routine monitoring in 1972. The Northwest Passage traces from Baffin Bay in the South toward M'Clure Strait.
A high-resolution look at sea ice The image above is based on high-resolution satellite data. We have zoomed in on an area of sea ice to show some of the unusual conditions that this year has brought. Note the immense chunks of sea ice (ice floes), some of them with melt ponds, visible as blue flecks on the ice. Normally, this region is a consolidated ice pack rather than individual floes. The ice edge has pulled back much further than normal from the coast.
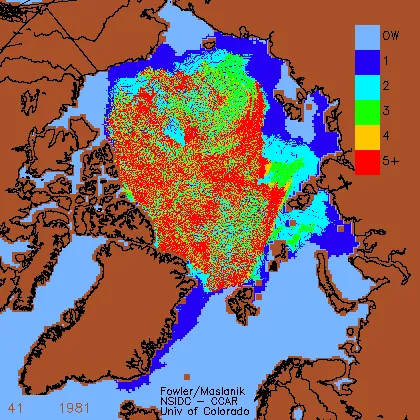
Changes in ice age and thickness Another aspect of the story for 2007 is the "memory" of the sea ice to changes over the past few decades. Specifically, there seems to have been a transition to younger, thinner ice beginning in the late 1970s. This reflects not only trends towards more summer melt and less winter ice growth, but changing winds that have transported fairly thick ice out of the Arctic Ocean into the North Atlantic, and decreased the length of time that ice is "sequestered" in the Arctic Ocean where it might have a chance to grow thicker.
Ice that has survived through one summer, called second-year ice, is typically thicker than first-year ice, and ice that has survived several summers is assumed to be thicker than second-year ice. To estimate ice age, our colleagues Chuck Fowler and Jim Maslanik at the University of Colorado used drifting buoy data along with information from satellites to assess the formation, transport, and melt of the ice, which they in turn used to estimate ice age. Results from this study reveal the area of oldest ice (i.e., ice older than four years) is decreasing in the Arctic Ocean, and being replaced by younger, and therefore, thinner ice. The region of the oldest (and thus thickest) ice is now confined to a relatively small area north of the Canadian Archipelago. Replenishment of old, thick ice is essential to the maintenance and stability of the Arctic summer ice cover, since thinner ice requires less energy to completely melt out in summer than thicker ice.
Click the image above to watch an animation of ice age in the Arctic from 1981 through 2007. The colors indicate the age of the sea ice in years; light blue is open water (OW). Areas in red are locations where the ice is five years or older, whereas the dark blue areas are first-year ice. The overall reduction in ice age over the past twenty-six years becomes evident as the animation runs through the years. The animation also shows seasonal variations in the ice cover as the first-year ice melts in the summer and regrows in the winter.
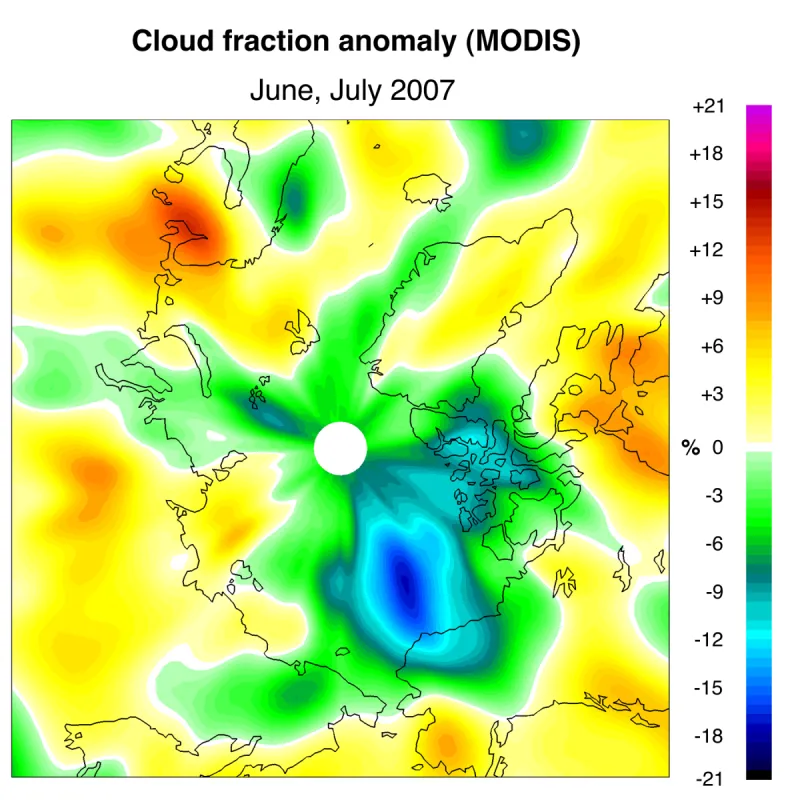
A note on cloud-cover over June and July of 2007 Our August 14 entry commented on the role of unusually clear skies and high temperatures in fostering rapid melt.
Our colleague William Chapman of the University of Illinois, Urbana Champaign, has examined cloud conditions more closely. The graphic above shows his plot of percent anomalies in Arctic cover for June through July, 2007, calculated in comparison to mean conditions over the period 2000 to 2006. Areas in green and blue are where cloud cover was less than normal. Note the large reductions in cloud cover north of Alaska compared to 2000 to 2006, consistent with rapid sea ice melt as more solar energy than usual reached the ice surface.
Ongoing high pressure, high temperatures, and clear skies
Atmospheric data averaged for August 1–18, 2007, show high atmospheric pressure still prevailing over the Arctic Ocean north of Alaska, with low atmospheric pressure in the Laptev Sea, broadly similar to the pattern seen for June through July. The high-pressure cell points to an ongoing tendency for relatively clear skies north of Alaska (as seen in Figure 3 above). Temperatures at 925 millibars (about 2,500 feet) have continued to be above normal across most of the Arctic Ocean, especially north of eastern Siberia, where winds are bringing in warm air from the south. This wind pattern has also continued to push ice away from the Siberian coast and into the central Arctic Ocean.
17 August 2007
Overview of current sea ice conditions Yesterday and today, Arctic sea ice surpassed the previous single-day (absolute minimum) record for the lowest extent ever measured by satellite. Sea ice extent has fallen below the 2005 record low absolute minimum and is still melting. Sea ice extent is currently tracking at 5.26 million square kilometers (2.02 million square miles), just below the 2005 record absolute minimum of 5.32 million square kilometers (2.05 million square miles).
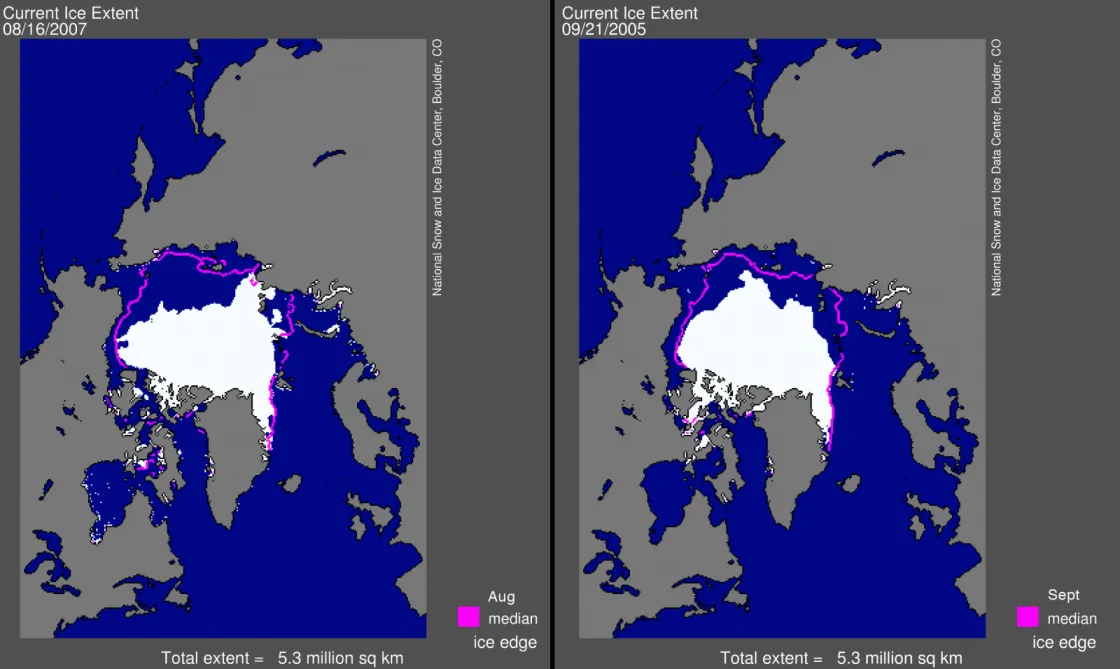
Arctic sea ice has now surpassed all previous records for the lowest absolute minimum extent. Satellite measurements recorded the previous record, 5.32 million square kilometers (2.05 million square miles), on September 20–21, 2005. As of this morning, the extent was 5.26 million square kilometers (2.02 million square miles).
The graphic above compares ice extent on August 17, 2007, with September 21, 2005. Note that the magenta lines, which indicate the corresponding monthly median for 1979–2000, look different from each other because the August monthly median is higher than the September monthly median.
Sea ice extent is particularly low in the East Siberian side of the Arctic (the Chukchi and East Siberian Seas) and the Beaufort Sea north of Alaska. Ice in the Canadian Archipelago is also quite low. Along the Atlantic side of the Arctic Ocean, sea ice extent is not as strikingly low, but is still less than normal.
Current sea ice conditions in context The graphic above shows the updated time series of daily ice extent for 2007, 2005, and the 1979 to 2000 average. As explained above, sea ice extent this morning was lower than the absolute minimum in 2005, the previous record-holder.
With about a month of further ice melt expected, it is clear that the 2007 annual minimum, expected in September, will almost certainly represent a significant decrease below even the last five years of record and near-record sea ice losses. Sea ice normally stops melting and starts to regrow some time in September, which is still some weeks away. As of today, ice extent in 2007 was 1 million square kilometers (386,000 square miles) less than the same day in 2005.
The bottom line: 2007 has already unseated the 2005 record, but we don't yet know by how much.
Important notes about the sea ice calculations: NSIDC calculates sea ice extent in three ways: single-day values (discussed above), five-day running means, and monthly means. To report the absolute minimum each year (which we have yet to reach in 2007), we use the five-day running mean value to reduce the "noise" that is inherent in the satellite data retrievals. Numbers concerning past record minima (see references throughout this page) are based on a retrospective data set which may report values that reflect slight changes (less than 0.1 percent) compared to previously reported values. Finally, many users of our data are most interested in monthly means (for example, averaging all days for a given September); we also provide these values as they become available.
14 August 2007
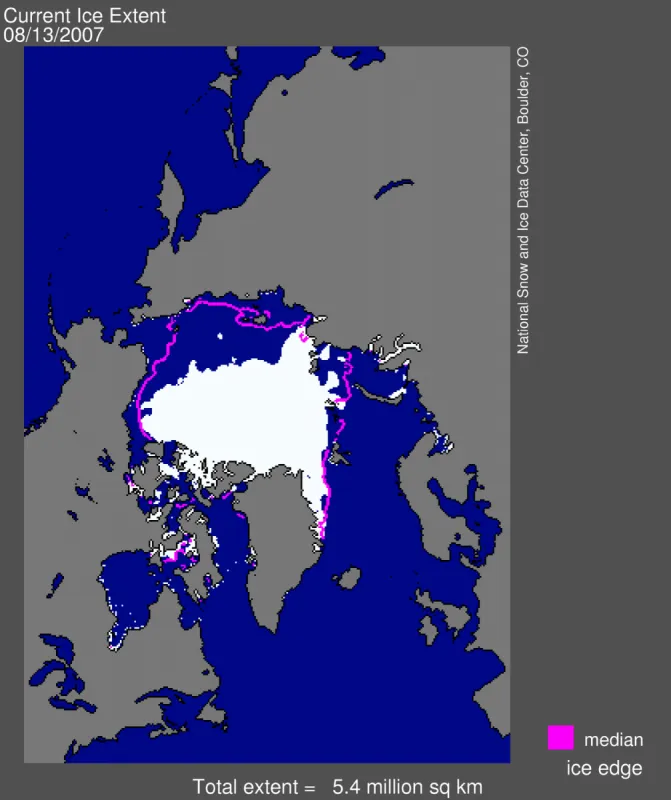
Overview of current sea ice conditions Sea ice extent is currently tracking at 5.4 million square kilometers (2.1 million square miles), with daily extents running at 940,000 square kilometers (361,000 square miles) below previous daily record lows, a significant decline from past years.
As discussed in our last report, Arctic sea ice extent in 2007 is on pace to set a new record minimum that could be substantially below the 2005 record. White areas in the graphic above define ice extent for August 13, 2007. The magenta line shows the median August sea ice extent for 1979 to 2000. Sea ice extent continues to decline, and stands at 5.4 million square kilometers (2.1 million square miles) for August 13, 2007, compared to a typical August monthly average of 7.7 million square kilometers (2.96 million square miles). Compared to average conditions, the ice edge has retreated markedly north of the Siberian and Alaskan coasts. Satellite data also indicates less ice in the channels of the Canadian Arctic Archipelago, with open water north of Ellesmere Island and Greenland—a region typically ice-covered year around.
Current sea ice conditions in context The graphic above shows the updated time series of daily ice extent for 2007, 2005, and the 1979 to 2000 average. We are already very close to surpassing the record absolute minimum of 5.32 million square kilometers (2.05 million square miles) that was observed on September 20–21, 2005. Unless conditions change markedly, there is still almost another month of ice loss ahead of us.
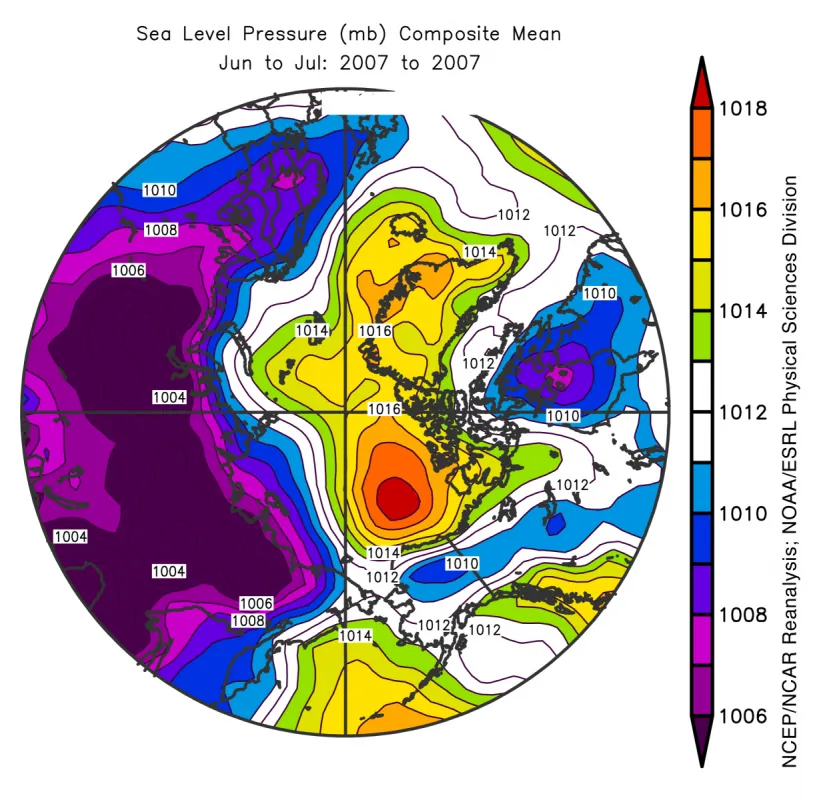
Contributing to the loss: sea-level pressure and clear skies Why have we seen such a rapid loss of sea ice in the summer of 2007? A major cause is unusually clear-sky conditions in the months of June and July. The image above is a contour map of sea-level pressure averaged for June and July. High pressure dominated the central Arctic Ocean during this period, promoting very sunny conditions just at the time the sun is highest in the sky over the far north. This led to an unusually high amount of solar energy being pumped onto the Arctic ice surface, accelerating the melting process. Satellite data show that skies over the Beaufort Sea were clear or mostly clear for 43 of the 55 days between June 1 and July 23, 2007.
The region over Siberia experienced fairly low pressure during the same time period. Winds blow clockwise around high-pressure areas and anti-clockwise around low-pressure areas. The combination of high- and low-pressure areas thus fostered fairly strong winds over coastal Siberia that were partly from the south, pumping warm air into the region and also contributing to a warming Arctic. At the same time, these winds from the south acted to push ice away from the coast and into the central Arctic Ocean, further reducing ice extent in the coastal areas.
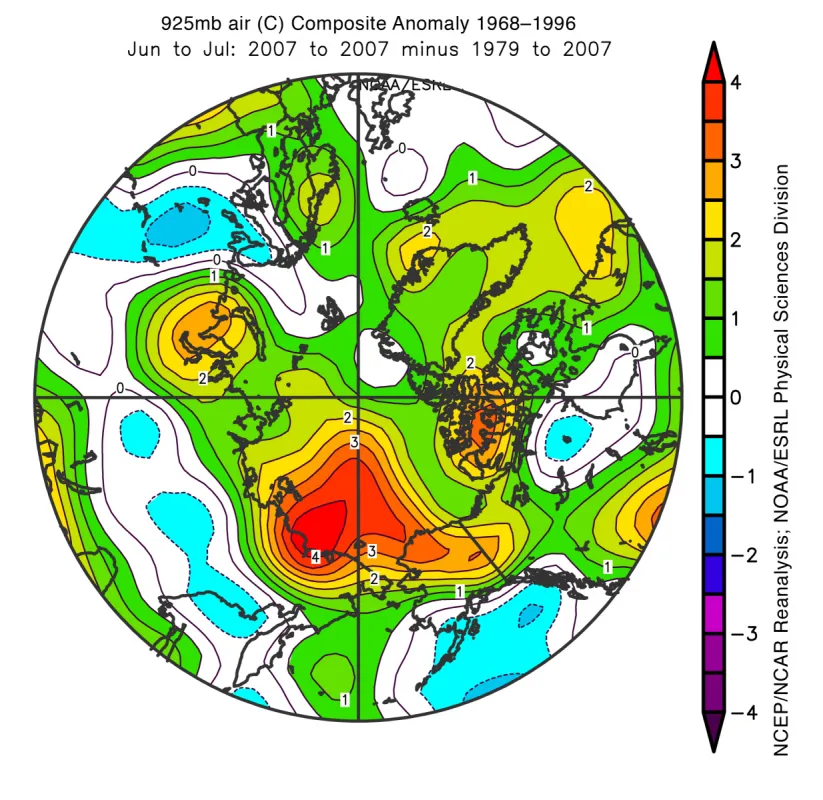
High temperatures The image above shows the warming pattern discussed above, using color to show the difference in June through July temperatures compared to the average over the period 1979 to 2007. (We show the temperatures at 925 millibars pressure, or about 750 meters [2,500 feet] in altitude, because they give a smoother temperature field than the surface map). Strong positive temperature anomalies occurred over much of the Arctic Ocean, accelerating ice melt, with the largest temperature anomalies (3 to 5 degrees Celsius or 5 to 9 degrees Fahrenheit) over the Siberian side where the largest ice losses have been observed. While 2007 was very warm, it is not the warmest year ever; 2004 showed stronger warm anomalies. However, the strength of the high-pressure anomaly, leading to clearer skies, is unusual for this time of year.
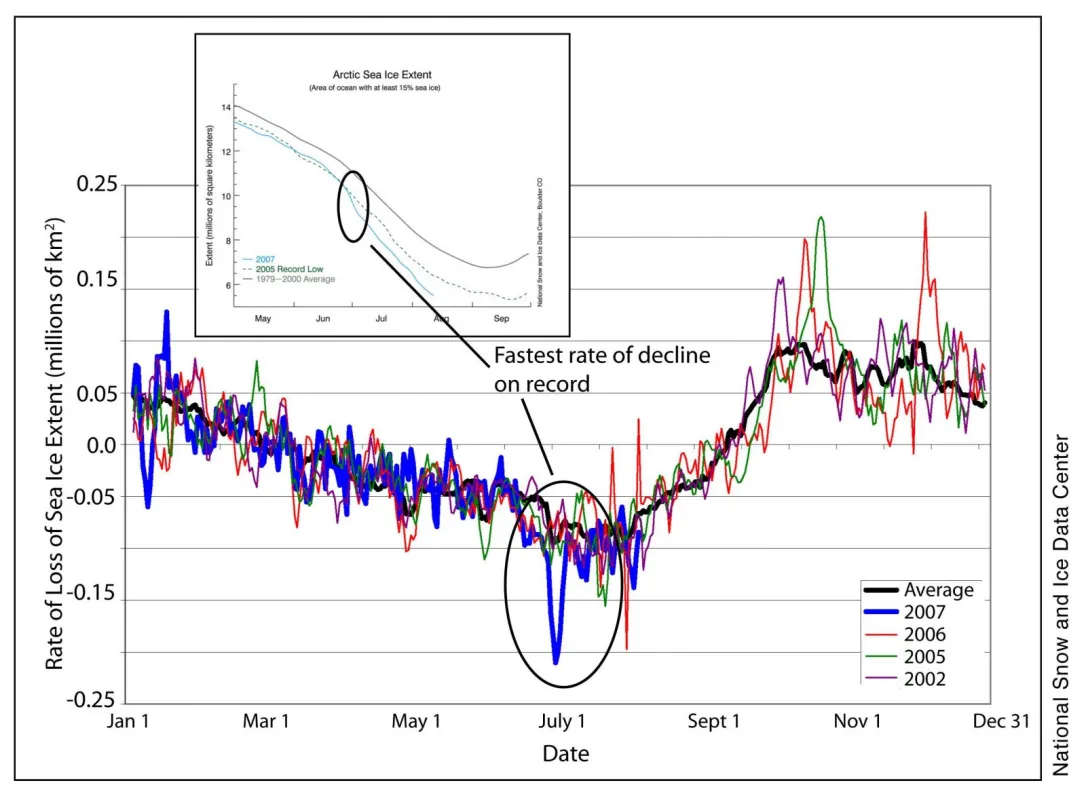
Record-breaking daily rates of sea ice loss in June and July Clear skies and warm temperatures in turn led to record-breaking rates of sea ice loss. In graphic above, we show a plot of the rate of loss of the ice for this year, previous record and near-record years, and the mean rate for 1979 to 2000. The inset plot is the same as the time series plot in the post. During a two-week period in late June and early July 2007, sea ice declined at a pace of up to 210,000 square kilometers (81,081 square miles) per day, or the equivalent of an area the size of Kansas each day. This rate was unprecedented in the satellite record, and changed the 2007 summer decline pattern from one similar to recent record years to unprecedented new low extents.
Taken together, the rapid sea ice losses that we've seen in June and July can partly be explained from the effects of this "triple whammy": it was warm; atmospheric circulation pushed ice away from the coast; and skies have been fairly clear.
However, what we are seeing also seems to reflect the "memory" of the ice to changes that have been occurring over the past couple of decades. In particular, there is mounting evidence of a shift from fairly thick ice to thinner ice, with this thinner ice more apt to completely melt out in summer. We’ll address these issues in upcoming reports.
10 August 2007
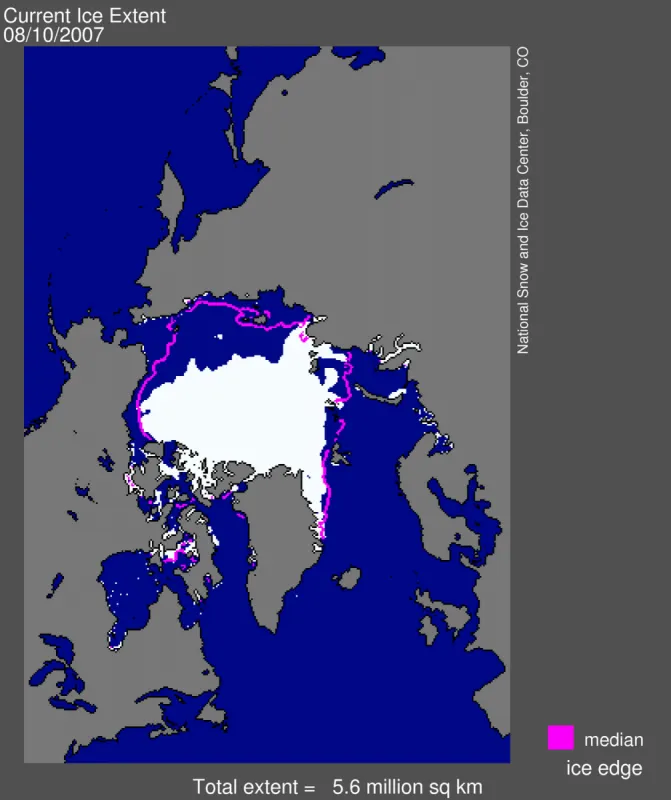
Overview of current sea ice conditions Sea ice extent is currently tracking at 5.8 million square kilometers (2.24 million square miles), with daily extents running at 700,000 square kilometers (270,272 square miles) below previous daily record lows, a significant decline from past years.
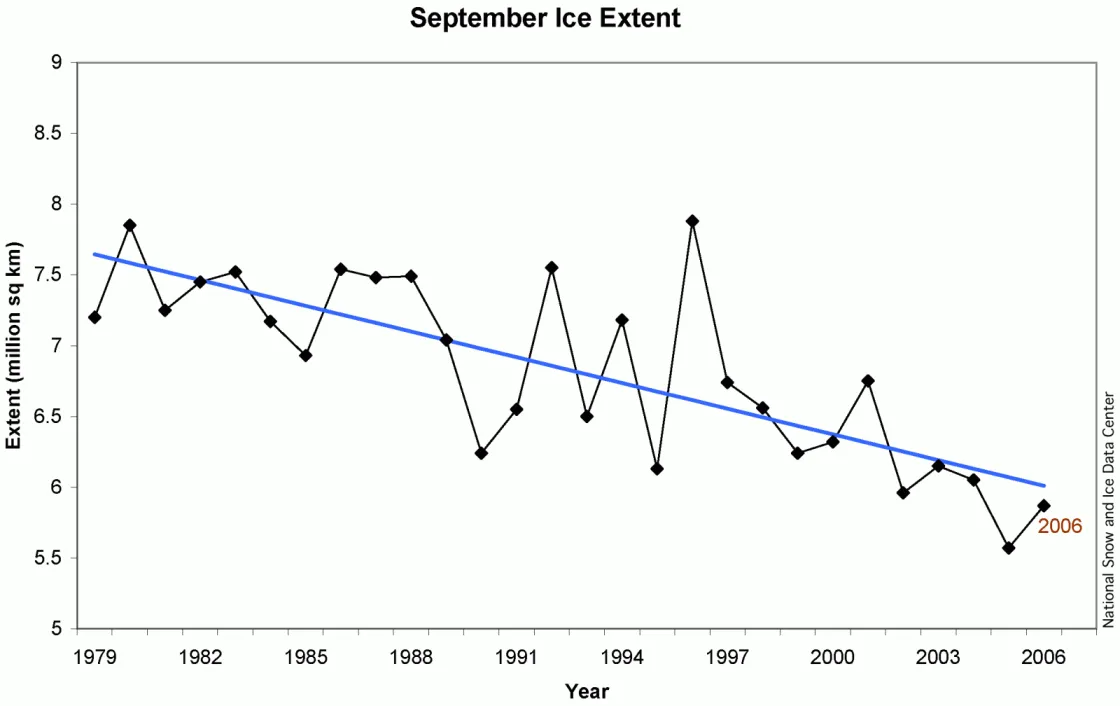
Brief overview of sea ice trends Before we look at the current numbers for Arctic sea
ice extent, let's revisit the trend that has developed over the last few years (shown above). In September 2005, after four years of lower-than-average fall sea ice extent, scientists using satellite data determined that the Arctic sea ice extent had reached a new record low: 5.32 million square kilometers (2.05 million square miles) versus the long-term average of 7.7 million square kilometers (2.96 million square miles).
- September 2006 sea ice extent was also well below average: 5.9 million square kilometers (2.3 million square miles). Although the 2006 minimum did not break the annual record low, June and July of 2006 set new monthly records—until they were broken this summer.
Current sea ice conditions: August 8, 2007
The image above shows the current daily sea ice extent; the magenta line indicates the median August sea ice extent from 1979 to 2000. Sea ice extent for August 8, 2007, was 5.8 million square kilometers (2.23 million square miles), compared to 7.7 million square kilometers (2.96 million square miles) for the long-term monthly August average. Note that although daily sea ice extent on August 8, 2007, slipped below the 2006 monthly sea ice minimum, it is important to use caution when comparing daily values versus monthly averages.
The bottom line is that Arctic sea ice extent for 2007 is on pace to set a new record minimum that could be substantially below the 2005 record. That said, weather conditions in the Arctic are variable. For example, in July of 2006, we were also on track to set a record minimum, but a cooler and cloudier August slowed the rate of ice loss. September 2006 sea ice extent ended up ranking just behind 2005, with the second-lowest sea ice extent of the satellite era. Such a pattern could appear in the Arctic this year, as well.
At this point in the 2007 melt season, this much is already clear: the Arctic is experiencing an unprecedented sixth consecutive year with much less sea ice than normal, and it looks like this year's sea ice melt season may herald a new and steeper rate of decline.
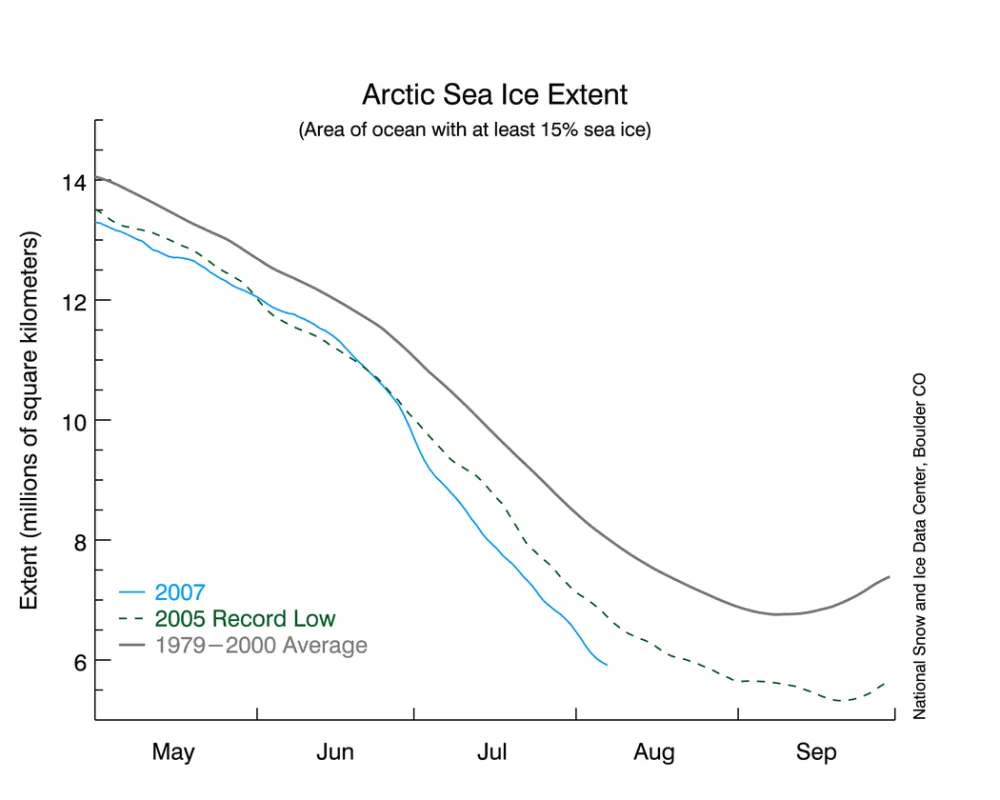
Current sea ice conditions in context
When we talk about the sea ice minimum, we are usually referring to the month that has the lowest monthly average sea ice extent (all the days of the month averaged together). Usually, September is the monthly sea ice minimum for each year. However, scientists also watch the absolute minimum, or the day of the year with the lowest ice extent.
The absolute minimum usually occurs during the second week in September, but as of only August 9, sea ice has already sunk below that mile-marker. In fact, the daily extent fell below the long-term average absolute minimum back in mid-July.
Why have we already passed the average absolute minimum, this year? The spring melt season started out slowly compared to 2005, the current record-holding year. However, the rate of sea ice loss accelerated during late June and early July, with daily rates at record levels for several days. While the rate of decline has slowed somewhat in the last week, it is still proceeding at a rapid pace.
The monthly picture reflects the pace of daily ice loss. July 2007 showed the most extreme ice-loss anomaly ever seen since the satellite record began in 1979, with a monthly average extent of only 8.1 million square kilometers (3.13 million square miles). This is 900,000 square kilometers (347,492 square miles) below July 2005—roughly the size of the states of Texas and Oklahoma combined.
Unless conditions change in an unprecedented way, the Arctic will continue to lose ice for at least another month.
All of this leads us to ask: why has the melt season progressed so quickly? The answer lies in a combination of high temperatures, changes in the age and thickness of ice, and fluctuations in atmospheric circulations. Please check back—we'll address these factors in detail as the melt season progresses.
