By Agnieszka Gautier
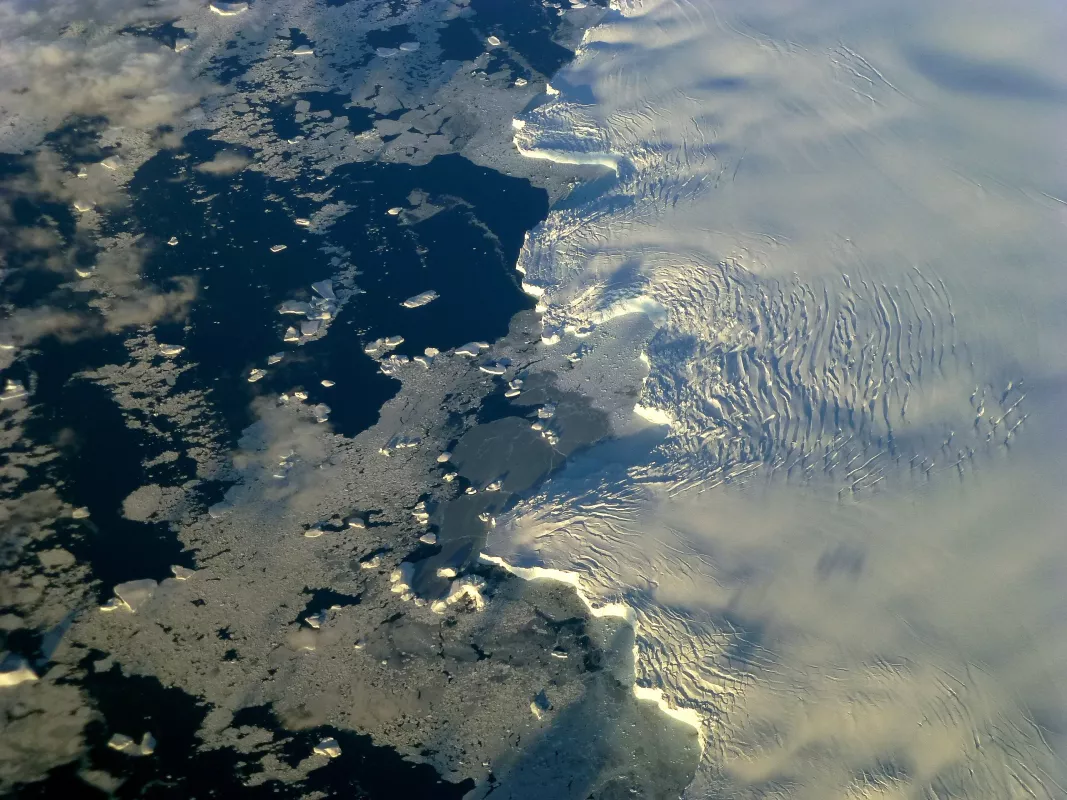
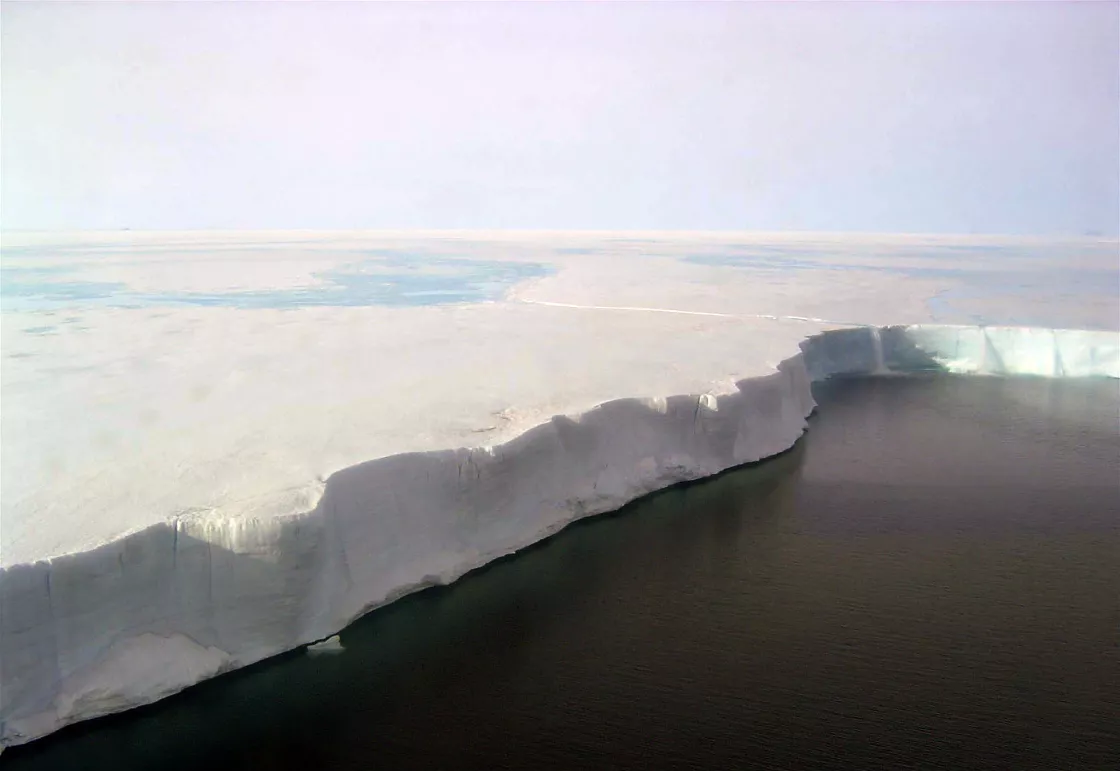
Ice shelves fringe the Antarctic Peninsula. In 1995, and then again in 2002, several of these large floating platforms collapsed. Ice shelves put the brakes on the continent’s glacial movement. When ice shelves retreat, the brakes are lifted and glaciers begin to accelerate. In 2002, the Larsen B ice shelf lost 1,255 square miles in thirty-four days. Scientists anticipated the glaciers would respond, but by how much? Would their acceleration extend way up stream or just be confined to the area closest to the ice shelf?
“The Antarctic Peninsula is a natural laboratory, a kind of glimpse into the future of Antarctica,” says Ted Scambos, lead researcher at NSIDC. It is an area of the continent that is experiencing rapid climate warming and major ice sheet changes. The Antarctic Peninsula has warmed roughly 3 degrees Celsius in the last 60 years, making this the most rapidly warming region in the Southern Hemisphere. It has lost around 25,000 square kilometers (about the size of Vermont) off the ice sheet with 87 percent of the glaciers retreating. Will its ice shelves continue to weaken? And will this process eventually be repeated elsewhere on the continent as climate warms in new regions? “Our team felt we had the best collection of tools to evaluate what was going on there in the decade after the last big breakup,” Scambos said. “What we came up with was a very interesting and complex map.”
The last twenty years
After the 2002 event, new answers began to emerge from the scientific community. “We saw these glaciers just took off,” Scambos said. Acceleration starts at the front of the glaciers and begins to propagate upstream almost immediately. “Within months,” Scambos added, “the ice fronts were flowing significantly faster.”
Over the following few years, this acceleration moved steadily upstream. Known as a kinematic wave, much like a tap topples a line of dominos, the disturbance from ice shelf breakups slowly extends throughout the mass of ice. For glaciers like those in the Antarctic Peninsula, up to 30 miles long, 4 miles wide, and as deep as 2000 feet, it can take five to fifteen years to propagate the wave into the upper reaches of the glacier and begin to move ice out from the main ice sheet faster. Several glaciers feeding the Larsen B Ice Shelf evolved in this manner after its 2002 collapse. But Scambos’s team was not sure how the rest of the northern Antarctic Peninsula had evolved over the period of warming. Some of the glaciers had been part of the 1995 and 2002 breakups, while others had seen only tiny changes in the past twenty years. “So we expected to see variety in glacial evolution here,” Scambos said.
The study
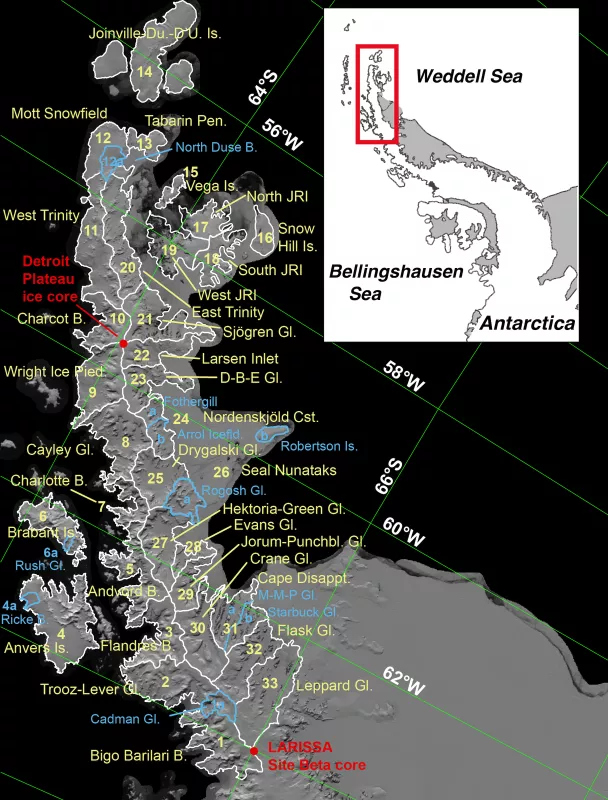
To get a closer look, the team turned to their maps. Starting in 2012, the authors began mapping ice elevation change for thirty-three glacier basins, focusing primarily on the 2003 to 2008 period. Using satellite stereo imaging to map broader areas, and satellite laser altimetry to measure precise elevation change along the satellite tracks, detailed elevation differences came into focus. “The main conclusion was a bit of a surprise,” Scambos said. “It appears that the whole area is losing mass.” And this led the team to make a big inference about the past. For the entire region to be responding this way means that multiple breakups must have occurred on the coastlines over the past 100 years. “Even though we can’t see the ice loss at the front, what we’re seeing is the remnant of that mass loss throughout the high elevations of the peninsula,” Scambos said. The area is losing elevation slowly in nearly every basin observed; therefore, the entire system seems to be losing mass.
This in turn means the area has been undergoing change for a long time, and that these effects of ice shelf loss persist for decades. “They have a really long run out in terms of the impact on the glacier. So, to further extrapolate, if another part of Antarctica breaks up, it’s not as if the mass imbalance is going to start fast and then fade out within a few years or even decades, it’s going to persist for a long, long time,” Scambos added. And that means that a small increase in warming can trigger a long-term effect on sea level.
On ice loss
Ice sheets weaken either because of warming waters, as seen in Pine Island Bay, or because of a warming atmosphere, which is apparent in the northern part of the Antarctic Peninsula. This area used to be stable, but atmospheric temperatures in the Peninsula crossed a tipping point. Now summer temperatures stay above freezing long enough for melt ponds to form over broad areas on the ice shelves, a key part of the mechanism of their disintegration. “Air temperature warming appears to have a more rapid response than the process of ocean circulation,” Scambos said. The northeastern Antarctic Peninsula responds faster to warming air than Pine Island Glacier does to warming waters. “If that level of response is what happens when you see air temperature warming, then the potential threat is a lot greater for air temperature,” Scambos added. That said, most of Antarctica is cold enough that it may be 50 to 100 years before summer melting, apparent on the Peninsula, appears elsewhere.
Reference
Scambos, T. A., E. Berthier, T. Haran, C. A. Shuman, A. J. Cook, S. R. M. Ligtenberg, and J. Bohlander. Detailed ice loss pattern in the northern Antarctic Peninsula: widespread decline driven by ice front retreats. The Cryosphere, 8, 2135-2145. doi:10.5194/tc-8-2135-2014. The British Antarctic Survey: Antarctic Peninsula and rapid warming Summary slides for NASA presentation


