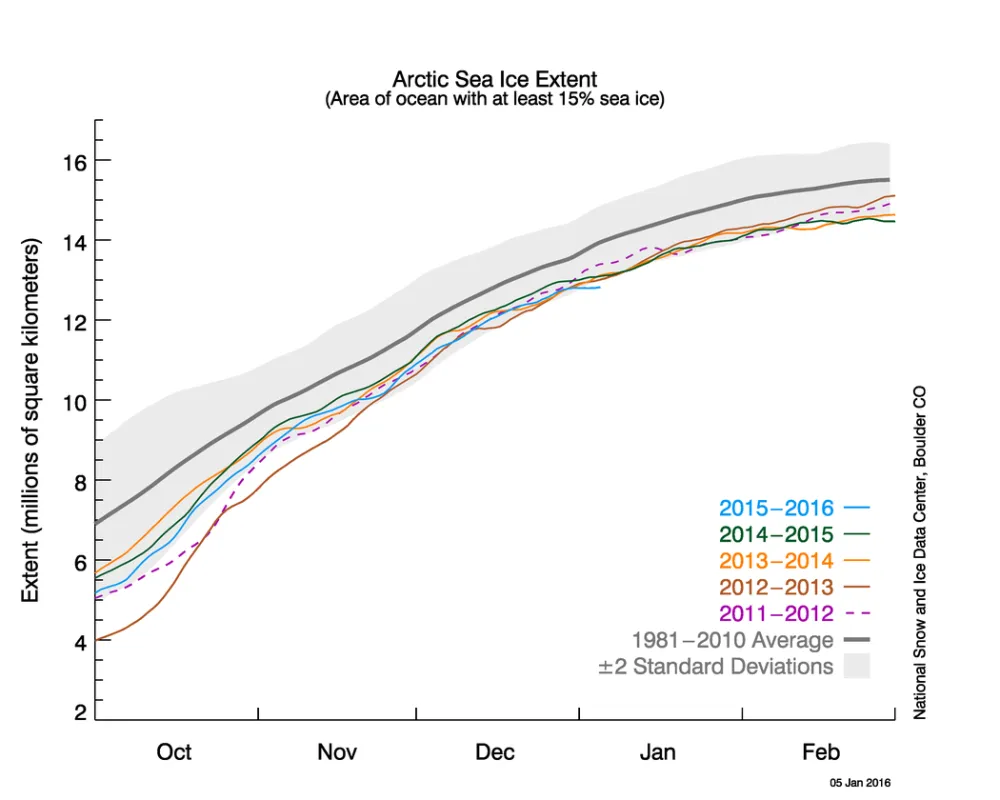
December ended with Arctic sea ice extent tracking between one and two standard deviations below average, as it did throughout the fall. This caps a year that saw the lowest sea ice maximum in February and the fourth lowest minimum in September. In Antarctica, December sea ice extent was slightly above average but far below the exceptionally large ice extents recorded for December 2013 and 2014. A slow-down in the rate of Antarctic sea ice growth in July was followed by near-average extents in the subsequent months. The first week of 2016 has seen very slow ice growth in the Arctic.
Overview of conditions
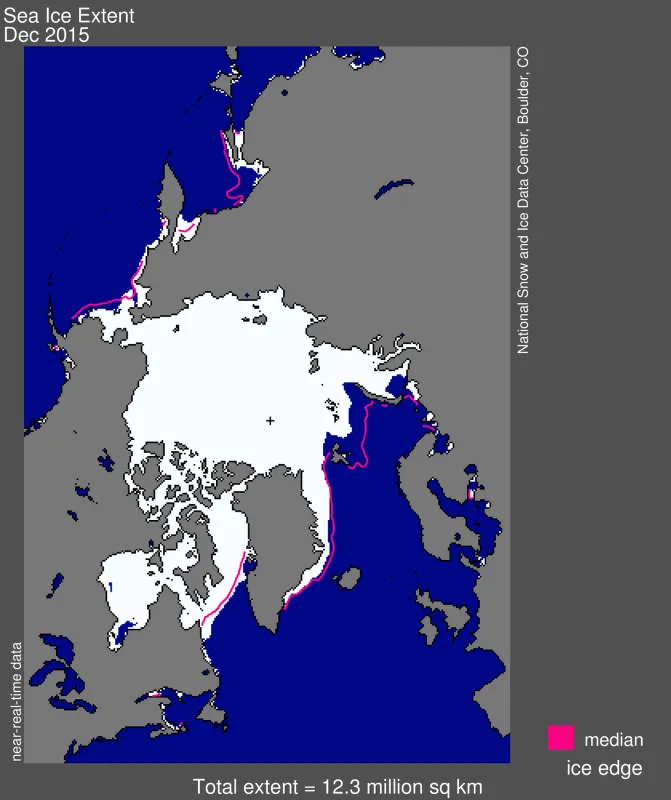
Sea ice extent for December 2015 averaged 12.3 million square kilometers (4.74 million square miles), the fourth lowest December extent in the satellite record. This is 780,000 square kilometers (301,000 square miles) below the 1981 to 2010 average for the month, and 260,000 square kilometers (100,000 square miles) above the record low for December recorded in the year 2010. The rate of sea ice growth slowed slightly through the month and nearly ceased advancing in the first days of the new year, perhaps related to a period of unusual warmth (see below). The ice is currently tracking near two standard deviations below the 1981 to 2010 long-term average. Sea ice extent is well below average in the Bering, Okhotsk, and Barents seas, partly balanced by slightly above average extent in Baffin Bay.
Conditions in context
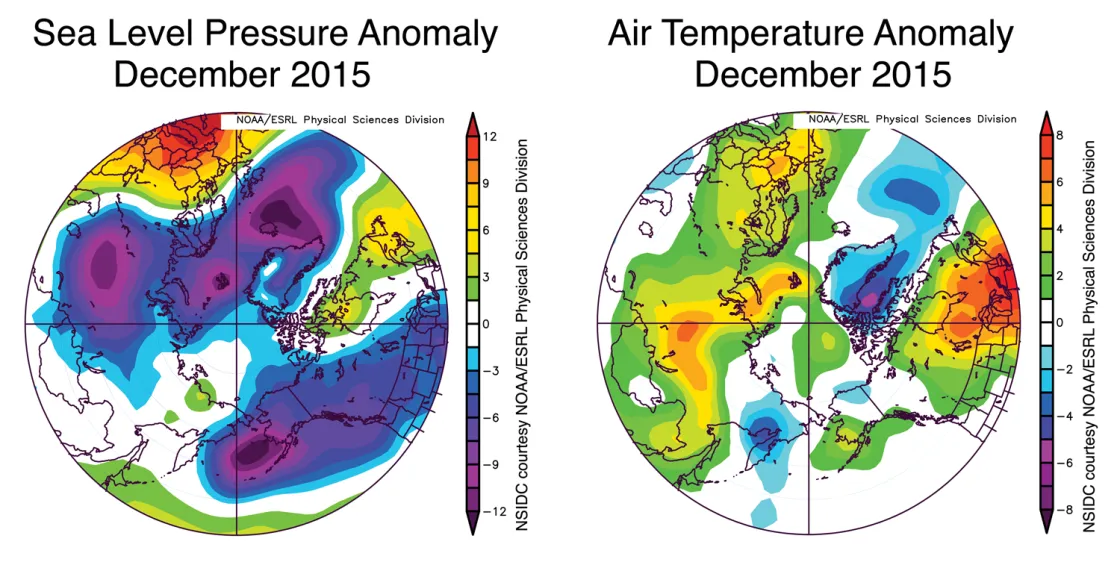
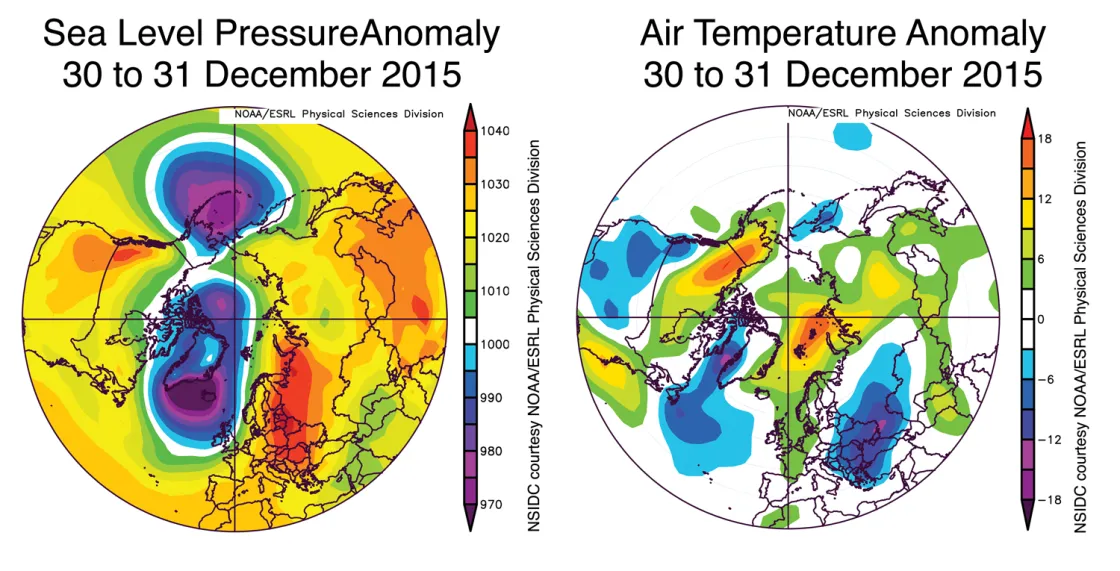
Arctic sea ice growth for December averaged 65,000 square kilometers (25,000 square miles) per day compared to the long-term average of 64,000 square kilometers (24,700 square miles) per day. Cool conditions at the 925 hPa level (2 to 4 degrees Celsius or 4 to 7 degrees Fahrenheit below average) existed in Baffin Bay, the Alaskan North Slope, and parts of eastern Siberia. A broad area of Europe and western Russia, including the northern Barents Sea, saw temperatures as much as 4 to 8 degrees Celsius (7 degrees to 14 degrees Fahrenheit) above average at the 925 hPa level. Conditions were also fairly warm over the central Arctic Ocean, north of the Canadian Arctic Archipelago. Sea level pressure was below average over much of the Arctic, especially from the northern North Atlantic to the Barents Sea and central Russia, and from the Bering Sea and south along the Canadian Pacific coast (7.5 to 12 millibars below average). This is consistent with the positive phase of the Arctic Oscillation through most of the month, a pattern that has persisted since the end of October.
December 2015 compared to previous Decembers
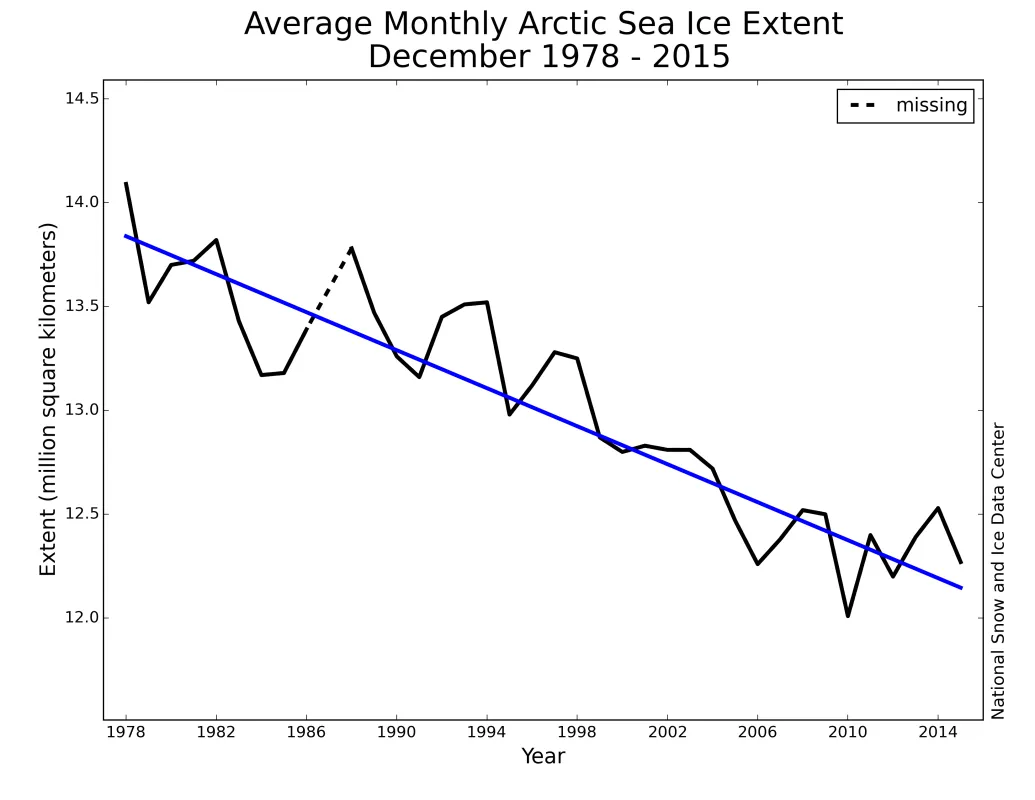
Arctic sea ice extent averaged for December 2015 was the fourth lowest in the satellite record. Through 2015, the linear rate of decline for December extent is 3.4% per decade, or -44,200 square kilometers (-17,000 miles) per year.
2015 in review
The year will be remembered for three major events in sea ice extent: the lowest Arctic maximum in the satellite record, the fourth lowest Arctic minimum in the satellite record, and a return to average levels for Antarctic sea ice extent after more than two years of record and near-record highs.
The record-low Arctic maximum occurred on February 25, 2015 and was among the earliest seasonal maxima in the 37-year satellite record. It was likely a result of very warm conditions in the Sea of Okhotsk and the Barents Sea (4 degrees Celsius or 7 degrees Fahrenheit above average), and low ice extent in the Bering Sea in March (when the maximum would more typically occur). These climate conditions were related to an unusual jet stream pattern as discussed in our April 7, 2015 post.
The fourth lowest Arctic minimum occurred on September 11, 2015 and was likely a consequence of very warm conditions in July and an increasingly young and thin ice cover. The thinner ice is consistent with a tendency in recent years for large polynyas that appear in the Beaufort and Chukchi seas in late summer. Although measurements by the CryoSat-2 satellite indicated that Arctic sea ice was thicker in 2015 compared to pre-2012 thicknesses, the ice behaved as though it was still quite thin.
From February 2013 through June 2015, Antarctic sea ice was at record or near-record daily extents. Antarctic sea ice set consecutive record winter maxima in 2012, 2013 and 2014. (Contrary to 2013 and 2014, autumn and spring conditions in 2012 were near-average.) But during this year’s austral mid-winter period, Antarctic sea ice growth slowed. Since then, extent in the Southern Hemisphere has generally been slightly above average. Climate effects from the building El Niño likely caused the shift during austral mid-winter. A strong El Niño is associated with a change in the position and strength of a major low pressure pattern near West Antarctica, called the Amundsen Sea Low. Weakening of the Amundsen Sea Low, and related impacts elsewhere around the ice edge in Antarctica, tend to reduce ice extent in the Ross Sea, eastern Weddell Sea, and elsewhere around Antarctica except near the Antarctic Peninsula.
The longer view
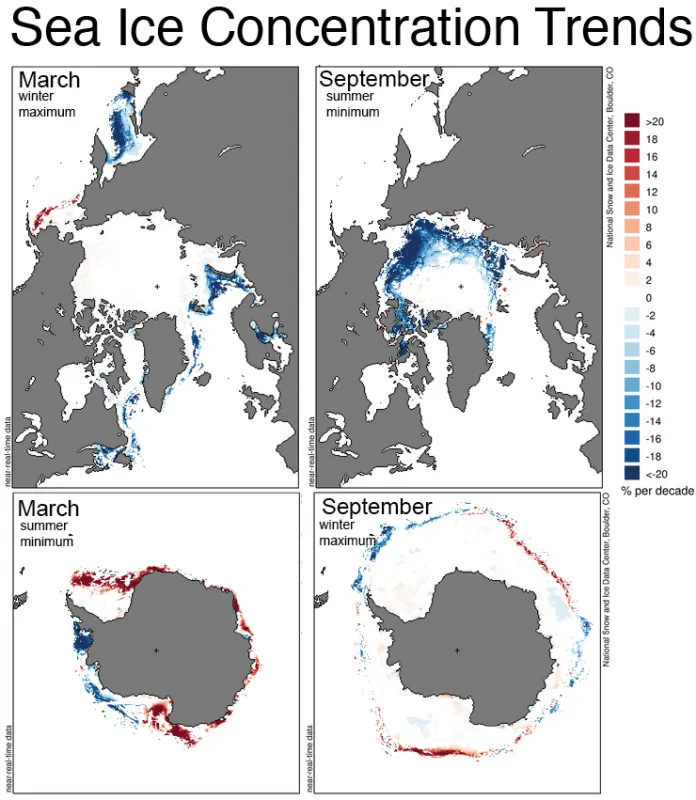
The satellite passive microwave record for sea ice now spans more than 37 years. As we have documented, clear downward trends characterize Arctic sea ice extent and concentration in all months, while somewhat less emphatic upward trends characterize Antarctic sea ice extent and concentration. A look at the geographic distribution of trends for the seasonal maximum and minimum periods provides insight into how the polar regions are changing. During the Arctic maximum, declines in extent and concentration are pronounced in the Barents Sea and Sea of Okhotsk, but ice cover has increased slightly in the Bering Sea. During the Arctic summer minimum, all areas show negative trends.
Antarctica presents a more mixed picture. During the Antarctic summer minimum, ice cover is increasing around much of the coastline from the Weddell Sea eastward to the western Ross Sea, but is declining sharply in the eastern Ross, Amundsen, and southern Bellingshausen seas. Winter ice cover in Antarctica is characterized by increases in the northern Ross Sea and the Indian Ocean sectors, and decreases in the northwestern Weddell Sea and the region south of Australia.
Ringing in the New Year with a brief polar heat wave
An exceptional weather event during the last days of the year brought a heat wave with surface air temperatures up to 23 degrees Celsius (50 degrees Fahrenheit) above average in the far north, and a brief period when surface temperatures at the North Pole approached or perhaps even exceeded the freezing mark. A temperature of +0.7 degrees Celsius was briefly recorded by a buoy weather station near the North Pole on December 30, 2015. The event was linked to the combination of a very strong low pressure system near Iceland and a somewhat less intense low pressure system located near the North Pole. This was associated with an amplified trough at 500 hPa over the northern North Atlantic and a pronounced ridge of high pressure at 500 hPa to the east over central Europe, extending into the Kara Sea. This created a strong, deep inflow of warm, moist air into the Arctic Ocean’s high latitudes. The low near Iceland strengthened rapidly in the last days of December, reaching a minimum pressure of 935 millibars, equivalent to a hurricane. While the event was remarkable and may account for the slow ice growth during the first few days of January 2016, it was short lived and is unlikely to have any long-term effects on the sea ice cover.
Further reading
Tilling, R. L., A. Ridout, A. Shepherd, D. J. Wingham. 2015. Increased Arctic sea ice volume after anomalously low melting in 2013. Nature Geoscience 8, 643–646, doi:10.1038/ngeo2489.
Thompson, A. “What happened to the Polar Vortex?” ClimateCentral.com. http://www.climatecentral.org/news/what-happened-to-the-polar-vortex-19866?
