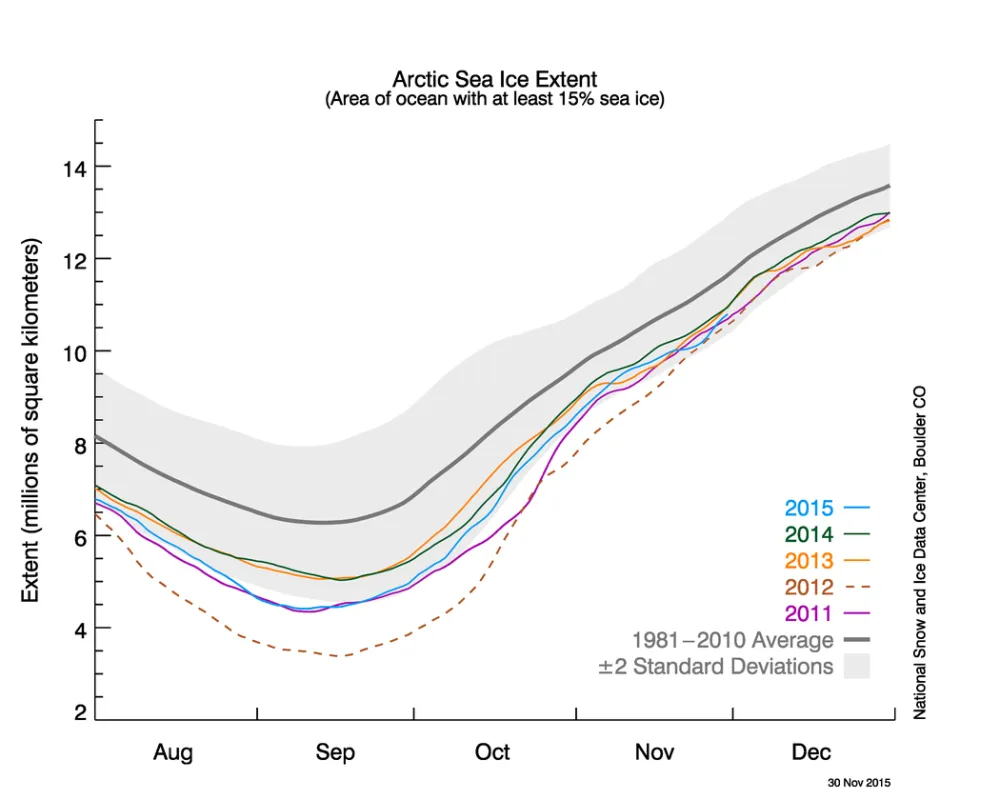
The rate of ice growth for the first half of November 2015 was quite rapid, but the pace of ice growth slowed during the second half of the month, only to increase again at the end of the month. Throughout the month, sea ice extent remained within two standard deviations of the 1981 to 2010 average.
Overview of conditions
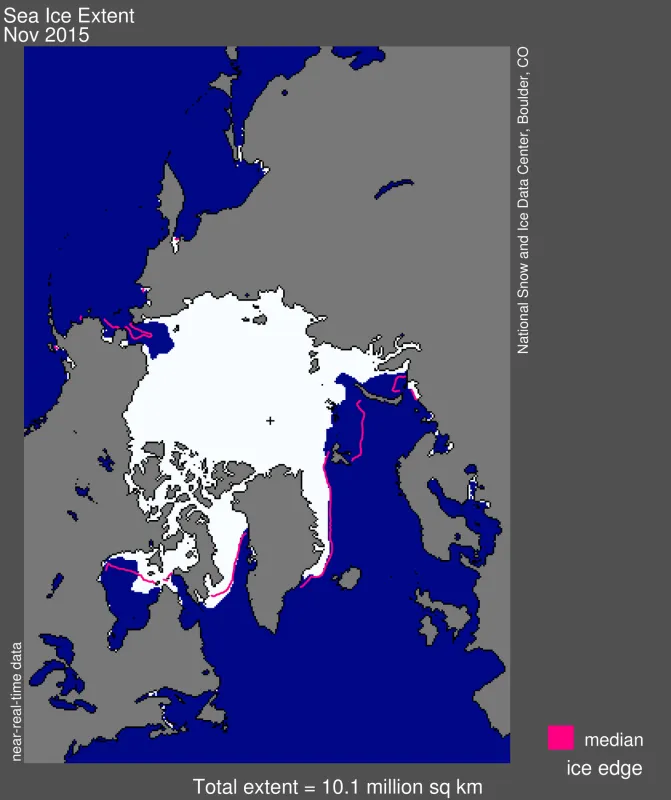
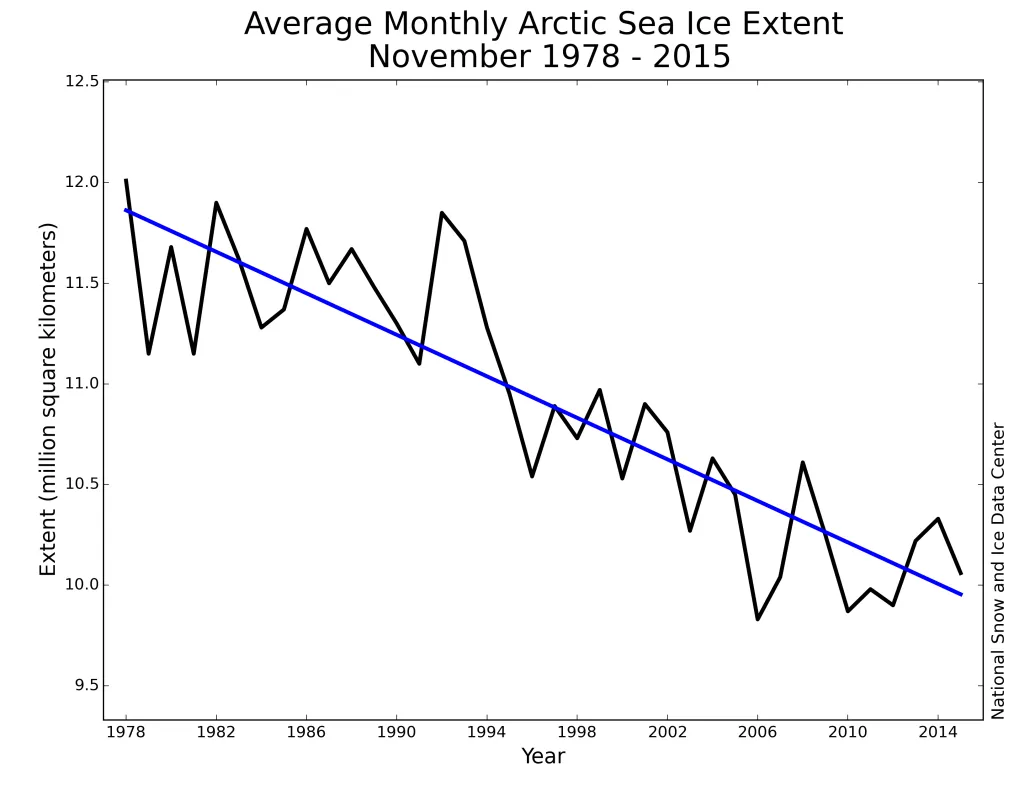
Arctic sea ice extent for November 2015 averaged 10.06 million square kilometers (3.88 million square miles), the sixth lowest November in the satellite record. This is 910,000 square kilometers (351,000 square miles) below the 1981 to 2010 average extent, and 230,000 square kilometers (89,000 square miles) above the record low monthly average for November that occurred in 2006. At the end of the month, extent was well below average in both the Barents Sea and the Bering Strait regions. Extent was above average in eastern Hudson Bay, but below average in the western part of the bay.
Conditions in context
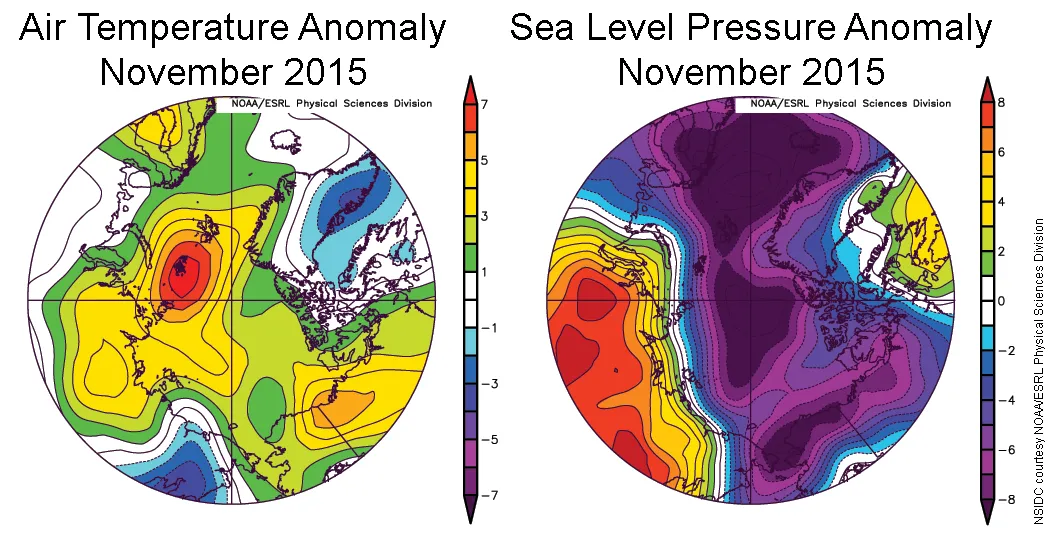
Air temperatures at the 925 millibar level were above average over nearly all of the Arctic Ocean; the area north of the Barents Sea, between Svalbard and the Taymyr Peninsula, was unusually warm (6 to 8 degrees Celsius, or 11 to 14 degrees Fahrenheit above average). Elsewhere, temperatures at the 925 millibar level were 1 to 4 degrees Celsius (2 to 7 degrees Fahrenheit) above average. NSIDC uses the 925 millibar temperature (about 3,000 feet above the surface) instead of the surface temperature because the 925 millibar temperature provides a better measure of overall warmth of the lower part of the atmosphere. From autumn through spring, the temperature at the surface can be greatly affected by the presence or absence of ice, while during summer, the surface temperature over ice will stay very close to the melting point.
The unusual warmth at the 925 millibar level north of the Barents Sea is related to an atmospheric circulation pattern featuring unusually high sea level pressure centered over northern Eurasia and unusually low pressure centered over the Arctic Ocean and northern North Atlantic. The strong pressure gradient (difference in pressure) between the areas of high and low pressure led to strong (and apparently warm) winds from the south. Open water in this area also extends unusually far to the north; while this likely contributed to above average temperatures even as high as the 925 millibar level, the wind pattern itself likely also helped to keep the ice from advancing south.
November 2015 compared to previous years
Arctic sea ice extent averaged for November 2015 was the sixth lowest in the satellite data record. Through 2015, the linear rate of decline for November extent is 4.7% per decade.
The average rate of ice growth for November 2015 was 29,800 square kilometers per day (11,500 square miles per day). However, this value averages out the rather rapid growth rate during the first half of the month with a much slower rate during the second part of the month and rapid growth near its end.
Loitering of the retreating sea ice edge in the Arctic seas
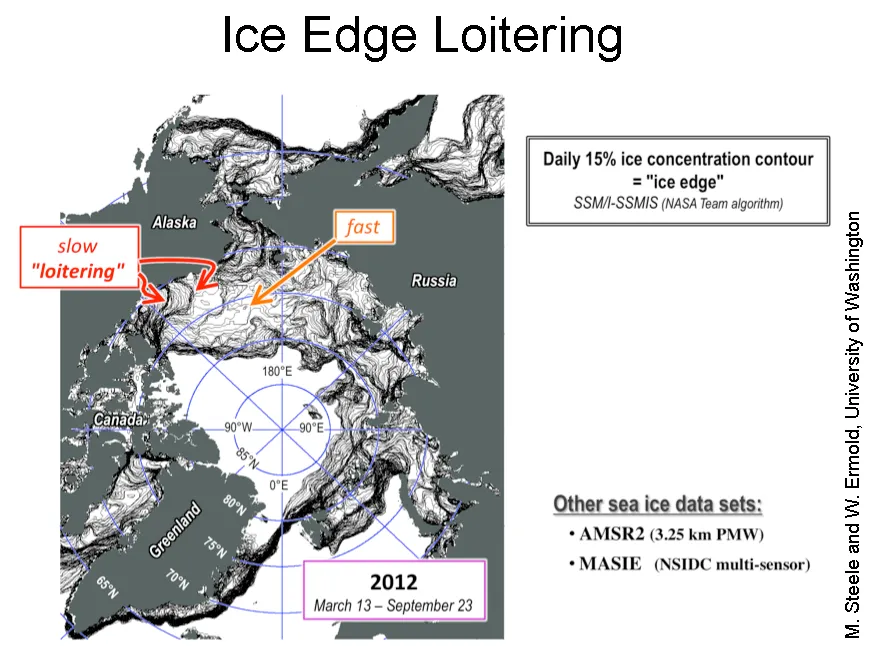
A recent paper by colleagues M. Steele and W. Ermold of the University of Washington, in press with Journal of Geophysical Research Oceans, provides insight into pauses that are often observed in summer sea ice retreat. On some days, the ice in a region is observed to retreat at a rapid pace, while on others it hardly moves at all. Steele and Ermold term this stationary behavior “ice edge loitering.” They find that loitering occurs through interaction between surface winds and warm sea surface temperatures in areas from which the ice has already retreated. When ice retreat in a particular region happens early enough in the melt season, the water warms above the freezing point from being in contact with warmer and and from sunshine. If winds later in the season push the ice floes into the warmed ocean area, the ice floes will melt until that surface layer reaches the freezing point. Thus while individual ice floes are moving, the ice edge as a whole appears to remain fairly stationary. The time scale of loitering (typically, 4 to 7 days) is naturally tied to the typical time scale of passing weather systems.
Steele and Ermold argue that loitering likely has important effects on both physical and biological conditions at the ice edge during the summer. Consider an ice edge that retreats at a constant rate through the spring and summer. In this case, air/ice/ocean conditions remain fairly constant along the ice edge, simply translating northward with the ice edge through the summer. By comparison, loitering induces persistent melting and thus changes in sea ice morphology, enhances ocean stratification, reduces upwelling of nutrients, and leads to changes in the atmospheric boundary layer. If the wind then shifts and allows rapid northward ice retreat, what happens to the area of loitering that has been left behind? And what are the conditions within the rapidly retreating ice edge? These are questions for future studies.
Comparisons between observed and modeled September sea ice extent
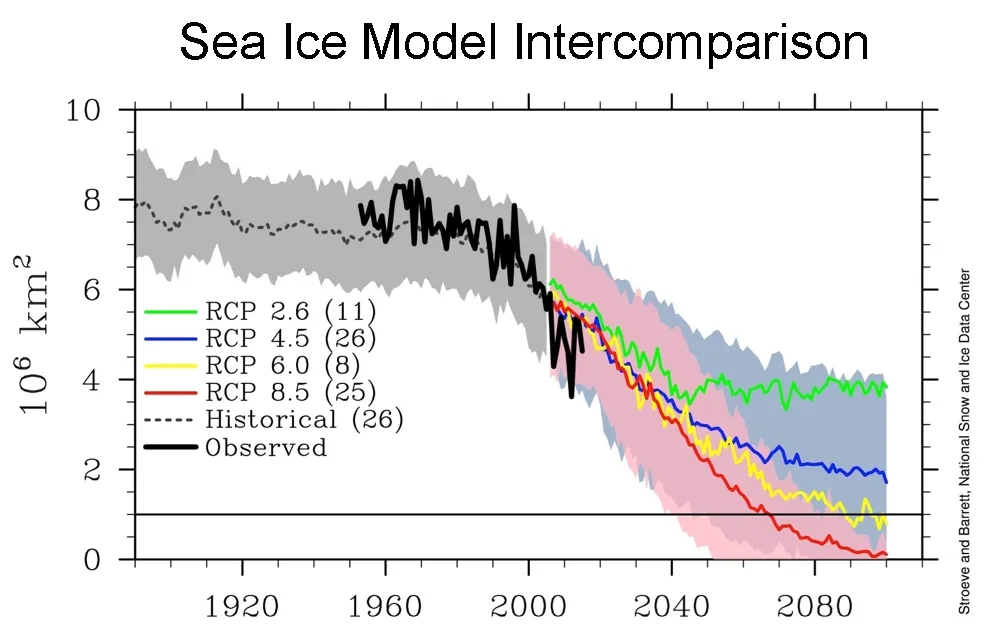
A paper accepted for publication by NSIDC scientist Stroeve and colleagues includes model hindcasts and projections of September sea ice extent and comparisons with observed extent. The hindcasts and projections are from the global climate models that participated in the Intergovernmental Panel on Climate Change 5th Assessment, and the observations include data that extend the record back to 1953.
The extent projections are shown for four different scenarios of future greenhouse gas growth (starting in 2005), termed Representative Concentration Pathways (RCPs). The RCPS relate to the radiative forcing at the top of the atmosphere that could occur at the year 2100. RCP 8.5 assumes a vigorous increase in greenhouse gas concentrations, while RCP 2.6 assumes a modest initial growth, followed by a reduction in concentrations. The shaded areas indicate the one standard deviation range of the sea ice extents projected by each model and the hindcasts.
The figure indicates that at least for the next few decades, which greenhouse gas scenario that becomes our reality is not especially important (there is much overlap between the projections). Instead, the simulated sea ice evolution is more strongly determined by both the natural variability in Arctic climate and by ongoing forcing from the current greenhouse gas content of the atmosphere. Only in the middle and later part of the 21st century do the differences in the greenhouse gas concentration from the different scenarios become important, and even then, there is a large range in projections from the different models for the same RCP. If our future climate and greenhouse forcing follows RCP 2.6, September ice extent may begin to stabilize by around the middle of the century. Figures like this are useful to policy makers negotiating climate treaties at the Paris 2015 U.N. Climate Change Conference.
References
Steele, M. and W. Ermold. 2015. Loitering of the retreating sea ice edge in the Arctic Seas. J. Geophys. Res. Oceans, in press. doi:10.1002/2015JC011182.
Stroeve, J. and D. Notz. 2015. Insights on past and future sea-ice evolution from combining observations and models. Global and Planetary Change, in press. doi:10.1016/j.gloplacha.2015.10.011.
