By Agnieszka Gautier
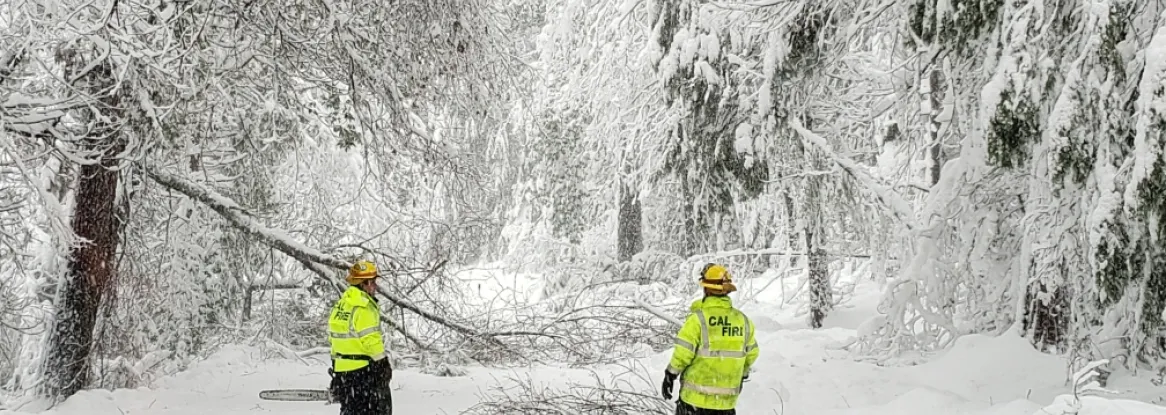
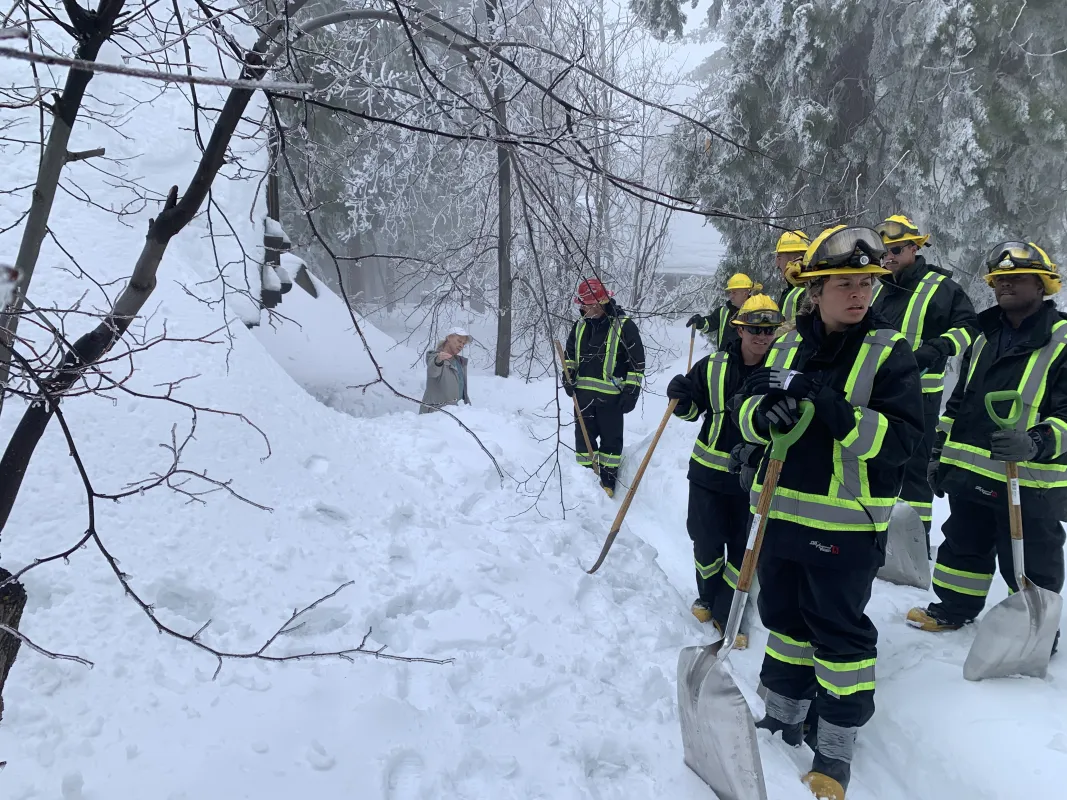
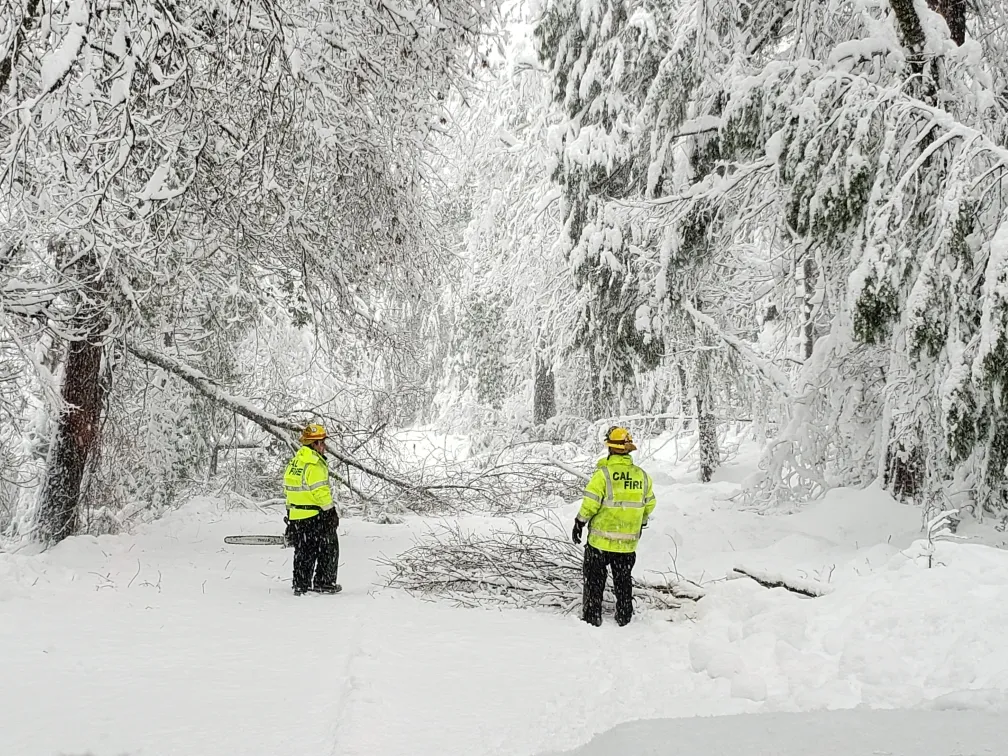
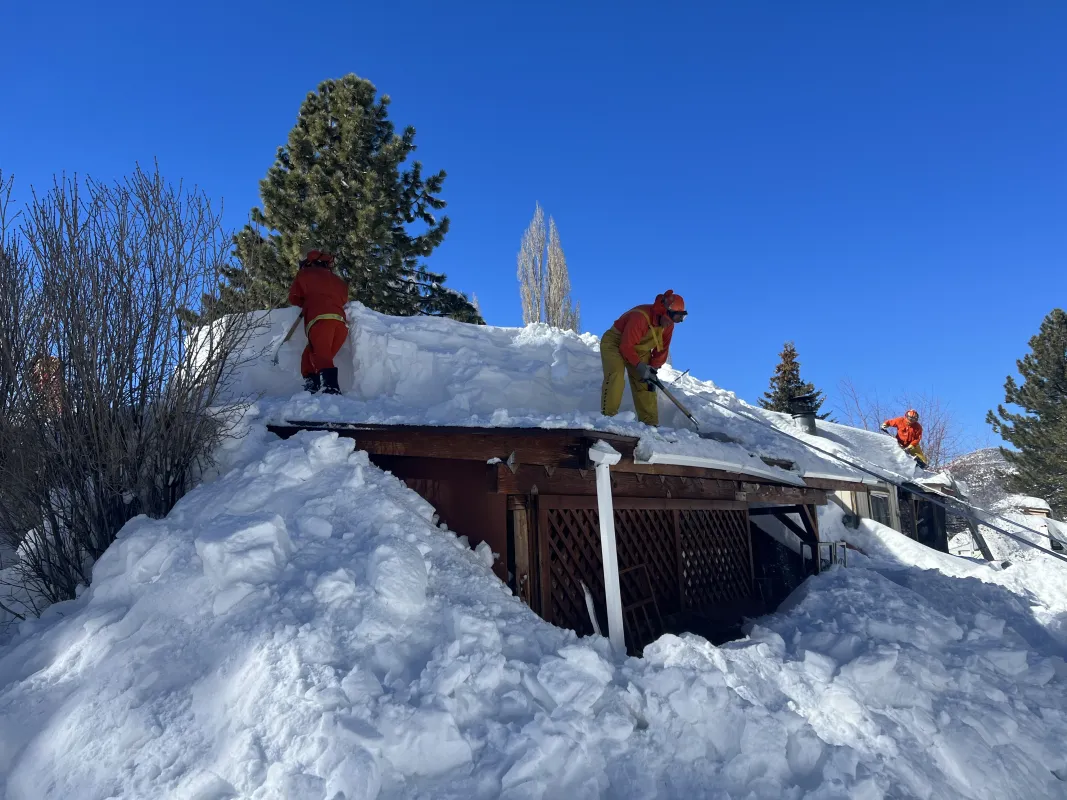
The 2023 winter brought record snowfall to California and other parts of the western United States. In late February, 12 feet of snow dumped on the Sierra Nevada within a week, cutting power to tens of thousands and trapping residents in their homes for days. In the San Bernardino Mountains east of Los Angeles, the county declared a state of emergency and rescued over 100 people, including disoriented skiers in white-out conditions and those stranded in vehicles. When snow touched chair lifts in California’s Bear Valley ski resort and buried entire houses in Mammoth Mountain, skiers were blocked from epic skiing. Mammoth then announced an extended ski season, staying open until August—the third time in the ski resort’s 69-year history.
But why so much snow?
Nine atmospheric rivers over a three-week period fueled the record-breaking snowfall. An atmospheric river carries moisture in long, narrow formations like a hose from Earth’s tropics, delivering a deluge of precipitation while traveling poleward. Despite the challenges residents faced, the snow brought much needed relief to the drought-stricken West, with the exception of the Pacific Northwest, where rapid snowmelt and early melt contributed to moderate drought conditions in late spring.
Snow is a vital resource for the western United States. Mountain snowpacks are frozen reservoirs, supplying as much as 75 percent of water in some western states come spring. It is no wonder then that water managers keep a vigilant eye on snowfall, using the latest technology to gain valuable insights.
Certain airborne or satellite instruments can accurately measure snow cover. The Moderate Resolution Imaging Spectroradiometer (MODIS), on board the NASA Terra and Aqua Satellites, has offered daily and global snow cover measurements for over two decades, but these instruments have limitations, especially for accurately calculating snow water equivalent (SWE): the amount of liquid water within a snowpack. To know how much water snow holds, you need snow depth and density measurements. But getting accurate snow depth data over a wide area is not easy. So, the National Oceanic and Atmospheric Administration (NOAA) program at the National Snow and Ice Data Center (NSIDC) offers the SNOw Data Assimilation System (SNODAS), which archives data from the National Oceanic and Atmospheric Administration (NOAA), and provides the best estimates of snow depth, snow cover, and especially SWE within the contiguous United States and parts of Canada.
Measuring snow water equivalent
SNODAS provides daily model outputs, or calculated approximations, of various snow parameters. SNODAS assimilates satellite-derived, airborne, and ground-based observations of snow-covered area and snow water equivalent (SWE) into a model to arrive at physically consistent outputs. The daily outputs are archived at NSIDC, providing users with consistent estimates of snow conditions, which can support water management and analysis.
Over ten thousand different users have interacted with SNODAS so far, assessing data that stretches back to 2004. The product is very popular, but not the easiest to use. One reason is that the data come in binary format, meaning encoded files need to be reformatted to be useful. Help articles show how this is done, and after reformatting, some users have taken the data to the next level.
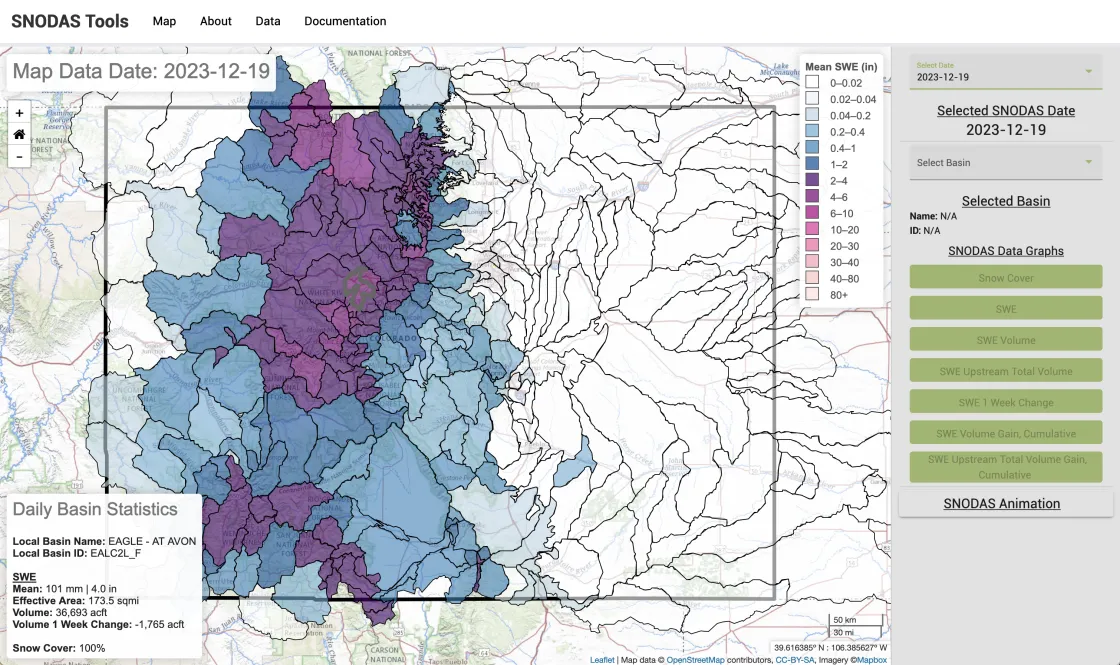
Steve Malers, the founder of the Colorado-based Open Water Foundation (OWF), shared a website with NSIDC that he created using SNODAS data, with funding from the Colorado Water Conservation Board. The nonprofit creates open-source software and open-data solutions to improve decision-making around water use. Malers’s site, called SNODAS Tools, offers historical data for over 200 Colorado water supply basins. Measurements are processed daily to calculate SWE and snow coverage. The website covers SWE from late 2003 to the present and includes an animation builder that allows a user to see the progress of SWE either as a calendar year or water year with various days of increment. Maler hopes to develop this tool for other states in the West.
SNODAS stands out as a data product because of its scope of snow information, but it is still model based rather than a direct measurement of conditions. Other tools are needed to improve snow data accuracy, but part of the challenge of gathering snow data is that snow is complex.
The scoop on snow and satellites
When temperatures drop, water vapor crystalizes into ice within clouds. The crystals grow by absorbing more water vapor until they eventually fall as snowflakes. Snow can be light and fluffy, heavy and slushy, or mixed with rain or hail. Snowfall can vary considerably within short distances even in calm conditions. Winds cause drifts, complicating snow depth readings. Snow can thaw and refreeze. It can also get caught on tree branches; so, if satellite, airborne, or field measurements are only taken from the ground, they may fall short. All instruments also struggle to distinguish between snowstorms.
Satellites are still lacking in their ability to accurately measure snowpack depth and SWE from space. Currently, algorithms have been developed to map snow cover and its reflective surface, known as albedo, using MODIS, which is archived at the National Snow and Ice Data Center Distributed Active Archive Center (NSIDC DAAC). Albedo can inform just how fast a snowpack may melt. “People often think temperature is the main cause of snowmelt, but it’s not,” said Karl Rittger, a research scientist at the Institute of Arctic and Alpine Research (INSTAAR) and an affiliate scientist at NSIDC. “Solar radiation drives snowmelt.” As a snowflake melts, it loses its fingers and compresses into a ball-shaped grain. With multiple cycles of melting and refreezing, these grains increase in size and get darker. Carried by the wind, dust deposits from pollution, wildfires, and agricultural erosion also darken the snow surface. The darker the snow, the faster the melt. Therefore, albedo measurements, which reveal how much solar energy is reflected, can help water managers know if a snowpack may linger or melt out sooner.
MODIS has been flying onboard satellites since 2001, providing more than 20 years of snow albedo records. The challenge with MODIS is that it uses an optical sensor that cannot see through clouds—a major drawback considering snowfall requires clouds. Likewise, within the data, clouds may read as snow, or snow may read as clouds, obscuring snow extent. The MEaSUREs Calibrated Enhanced-Resolution Passive Microwave Daily EASE-Grid 2.0 Brightness Temperature product, also archived at NSIDC DAAC, consists of passive microwave measurements that have been collected in limited sunlight through cloud cover at a resolution of 3.125 kilometers. This product is great for light snow cover areas like tundra, but it cannot measure deep snowpacks like those in the Rockies and Sierra Nevada, where MODIS and its successor, the Visible Infrared Imaging Radiometer Suite (VIIRS), offer fairly accurate measurements of snow extent, or snow cover, on a daily, global scale.
Other snow data products
The MODIS snow covered area and grain size (MODSCAG) model is the most recent addition to snow data. “Unlike earlier algorithms that used two bands of satellite information, MODSCAG uses all seven bands from MODIS,” says Rittger. MODSCAG uses something called spectral mixture analysis to distinguish physical properties like snow, rock, or vegetation, rather than using statistical equations to calculate snow cover. Because it is physically based, it is easier to verify its data. For instance, MODSCAG has been validated over the western United States using airborne remote sensing campaigns, Airborne Snow Observatory (ASO) 3-meter snow maps; ASO data are available at NSIDC DAAC. MODSCAG data will be available in the future at the DAAC.
NASA continues to scrutinize the future of snow satellites. NASA SnowEx is a multiyear field campaign for scientists to figure out the best technology in various landscapes for potentially measuring snow properties from space.
Beyond NOAA’s SNODAS and NASA’s MODIS products, NOAA’s US National Ice Center Interactive Mulitsensor Snow and Ice Mapping System (IMS) Daily Northern Hemisphere Snow and Ice Analysis offers daily snow cover maps. This popular product attracts wide interest groups. For instance, wildlife biologists use snow and ice maps for their annual waterfowl status report. Snow cover data help illustrate conditions in geese and swan nesting areas. Persistent snow cover can reduce available nest sites, delay nesting activity, and often result in decreased reproduction.
Another snow tool is a collaborative project between the Institute of Arctic and Alpine Research (INSTAAR) and NSIDC known as Snow Today. This website offers monthly analysis during the Northern Hemisphere’s snow season and daily data visualizations that show snow conditions in near real-time across the western United States. An interactive Snow Viewer allows users to easily view snow cover as a percent, albedo as a precent, the length of snow cover, and percentage of radiative forcing across the western United States, a selected state, or as a Hydrologic Unit Code.
Packing into the snowpack
Water managers briefly sighed with relief at the 2023 record snowfall because it mitigated some longstanding effects of long-term drought and the over-utilized water supply in the US West. Still, the region struggles to balance its population with water supply, especially as it remains a hot spot for migration, placing further pressure on water demands. According to the 2020 US census, eight of the 15 fastest-growing cities are in the US West, with five in Arizona. Between Utah and Arizona lie Lakes Powell and Mead, the two largest reservoirs in the United States and major sources of water for the western United States. Though the lakes benefited from a heavy snowpack in 2023, one year is not enough to make up for 20 years of drought.
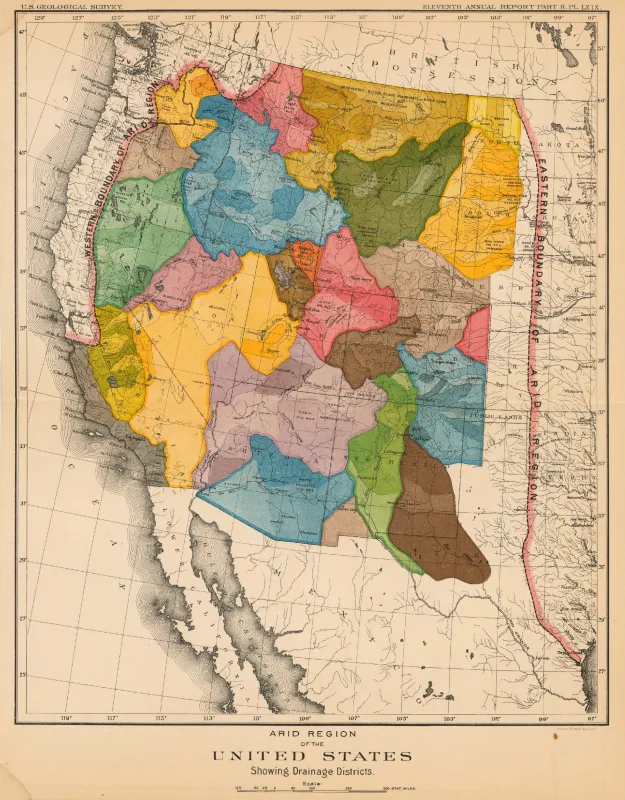
Ironically, Major John Wesley Powell, whom Lake Powell was named after, had hoped to avoid this situation. In 1890, 20 years after barely surviving a three-month long exploration down the Colorado River through the Grand Canyon, he testified in front of the Senate committee in Washington, DC, to advise on the potential development of western deserts. The committee, which included senators from western states, wanted affirmation that manufactured irrigation could sprout a verdant West.
To the senators’ dismay, Powell presented a map of the West dissected by natural watershed rather than state lines. This first-of-its-kind, ecological map presented water as the rule of the land, showing how its flow should determine land use, not state lines. Powell argued for the land's sustainability but lost out to competing financial and political interests.
So, the struggle of the arid West continues. As our data-capturing tools improve and our knowledge broadens, scientists and water managers need to work together to responsibly manage the delicate balance of a finite water supply.
Further reading
Overview of NASA's MODIS and VIIRS Snow-Cover Earth System Data Records
Snow data campaigns
NASA Airborne Snow Observatory (ASO)
Snow data instruments
NASA Moderate Resolution Imaging Spectroradiometer (MODIS)
NASA Visible Infrared Imaging Radiometer Suite (VIIRS)
Snow data sets
MODIS/Terra Snow Cover 5-Min L2 Swath 500m, Version 61
MODIS/Terra Snow Cover Daily L3 Global 500m SIN Grid, Version 61
Snow Data Assimilation System (SNODAS) Data Products at NSIDC, Version 1
Snow data visualization and websites
Snow Today's Snow Viewer
Access data through the NSIDC DAAC
NASA's NSIDC DAAC manages, distributes, and supports a variety of cryospheric and climate-related datasets as one of the discipline-specific Earth Science Data and Information System (ESDIS) data centers within NASA's Earth Science Data Systems (ESDS) Program. User Resources include data documentation, help articles, data tools, training, and on-demand user support. Learn more about NSIDC DAAC services.
Access data through NOAA@NSIDC
NSIDC archives a variety of data sets on behalf of NOAA. In addition to archiving data, the NOAA@NSIDC provides data users with multiple methods of support: documentation, help articles, data tools, training, and on-demand support. Learn more about NOAA@NSIDC services.
