Arctic sea ice extent declined more slowly during August 2021 than most years in the past decade, and as a result, this year’s September minimum extent will likely be among the highest since 2007. Part of the reason for this is a persistent low pressure area in the Beaufort Sea, which tends to disperse ice and keep temperatures low. A remaining question is whether a large area of low concentration ice north of Alaska will melt away. Antarctic sea ice is nearing its seasonal maximum, and the monthly mean extent for August was the fifth highest in the satellite record.
Overview of conditions
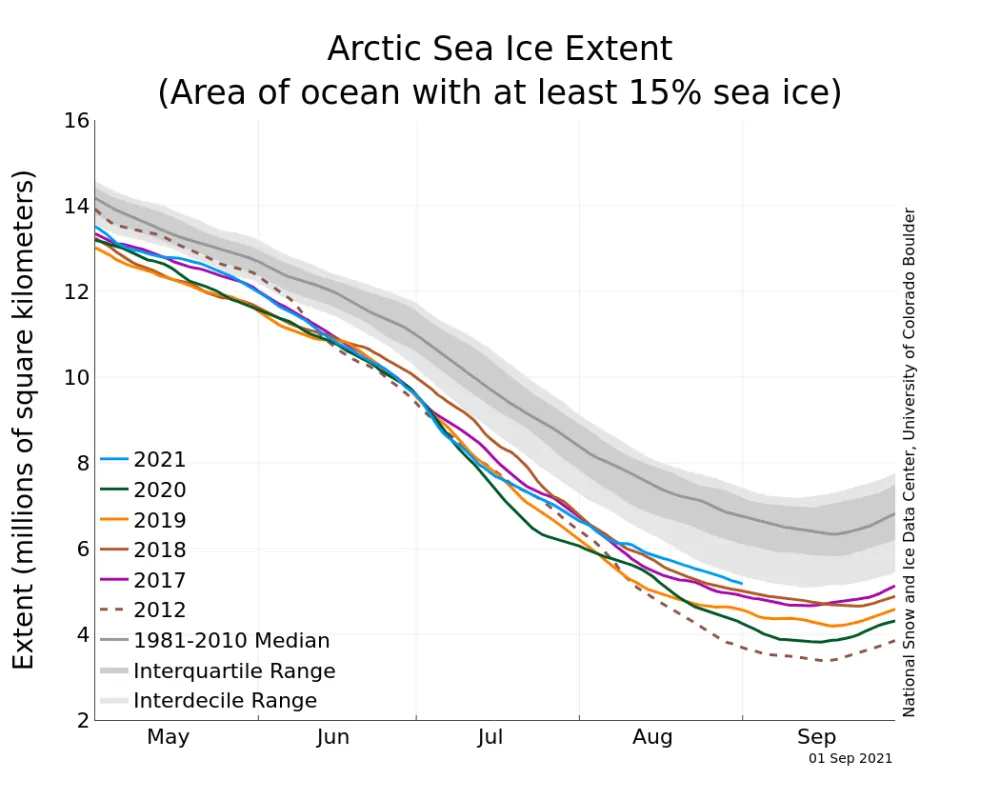
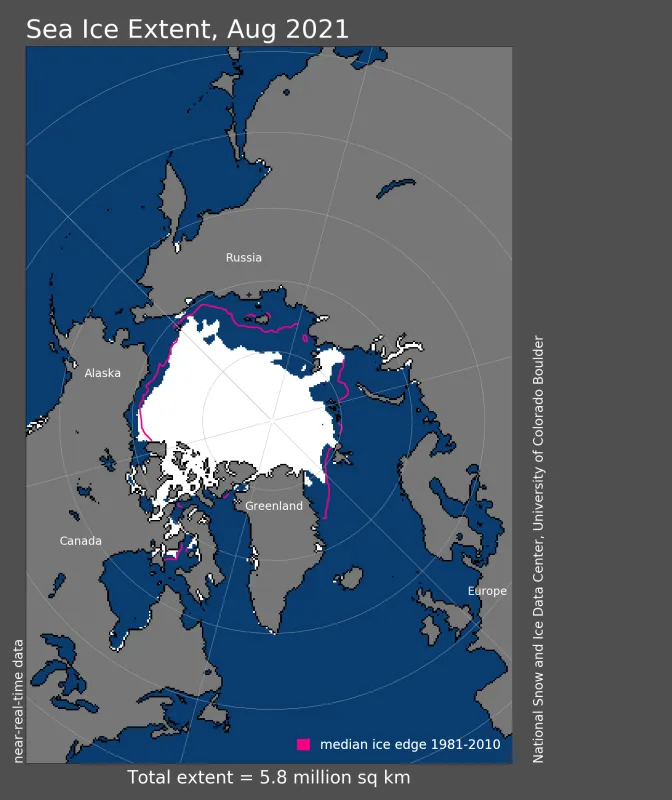
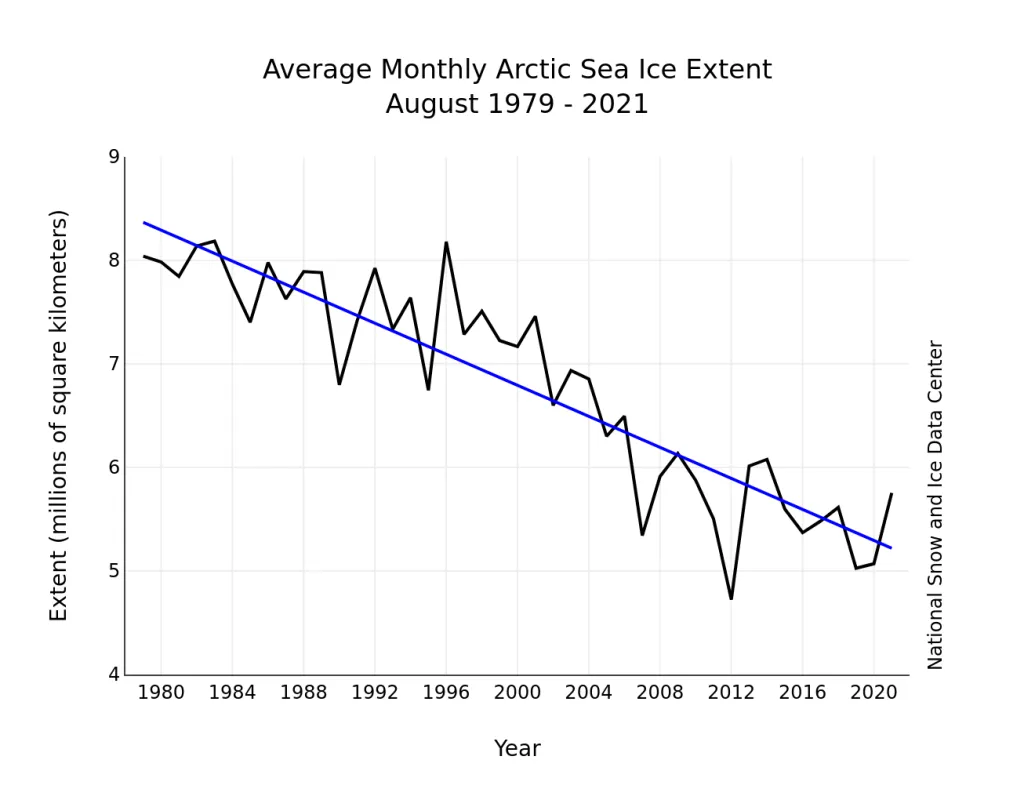
The decline in sea ice extent during August was relatively slow but steady after a pause in ice loss around August 9. The average daily loss was 33,000 square kilometers (12,700 square miles) per day, although by the end of the month the pace of ice loss increased to 51,000 square kilometers (19,700 square miles) per day as areas within the Beaufort and Chukchi Sea started to lose more ice. The monthly average extent for August 2021 is 5.75 million square kilometers (2.22 million square miles) (Figure 1a). This is 1.03 million square kilometers (398,000 square miles) above the record low for the month set in 2012 and 1.45 million square kilometers (560,000 square miles) below the 1981 to 2010 average. The average extent for the month ranks tenth lowest in the passive microwave satellite record.
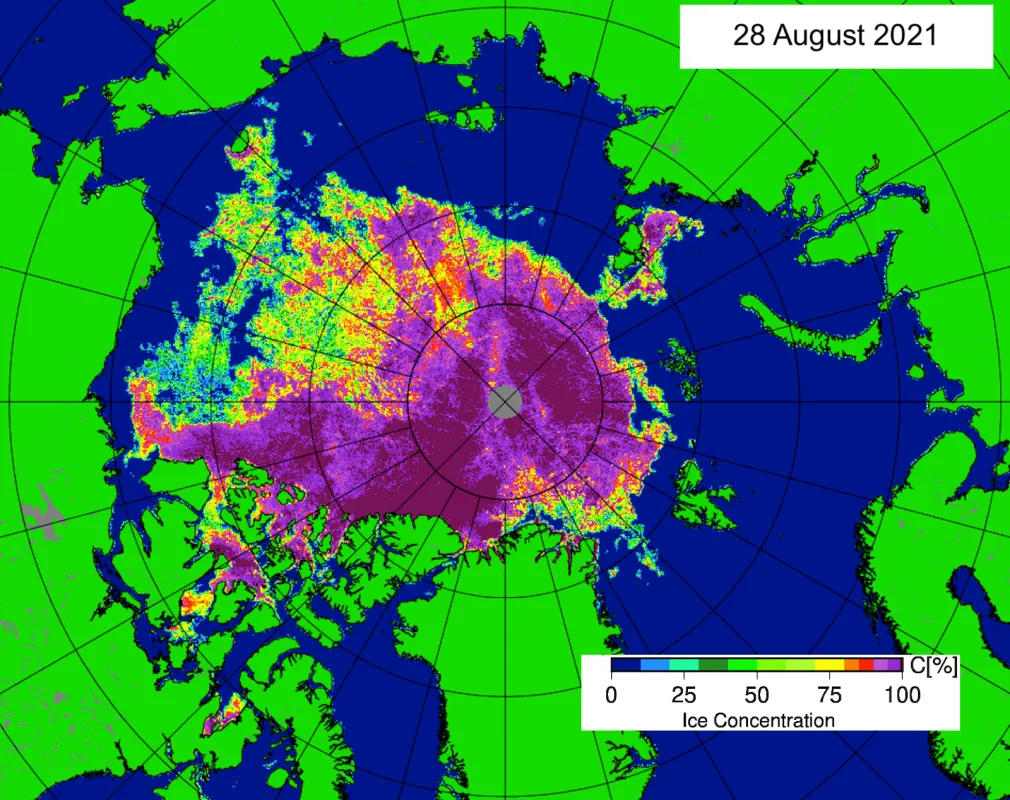
By the end of the month, large areas of the Beaufort and Chukchi Seas were covered by low concentration ice (25 to 75 percent; Figure 1b); some of this ice may yet melt away or fall below the 15 percent concentration threshold adopted for calculating ice extent. Many other areas have unusually low extent, such as Fram Strait and north of Svalbard and Franz Josef Land. As noted in our July post, open water persists north of Greenland in the Wandel Sea, an area that has rarely been open in past years. A small area of ice persists in the eastern Kara Sea (Figure 1c). At this time of year, any remaining sea ice loss is primarily driven by melt from heat absorbed in the ocean mixed layer. Compaction from northward winds may also reduce ice extent.
Conditions in context
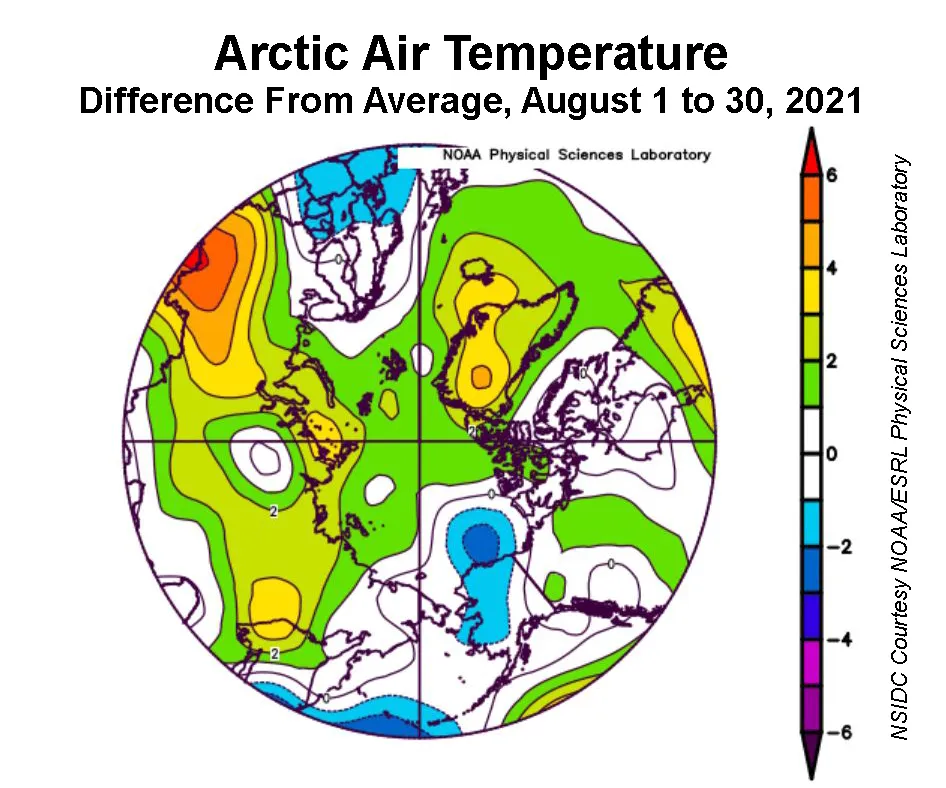
A pair of monthly-averaged high and low air pressure regions governed the weather in the high Arctic in August, centered in the northernmost Laptev and the central Beaufort Seas, respectively. These patterns created strong winds from the north over the Alaska and Bering Sea region, leading to temperatures at the 925 hPa level (approximately 2,500 feet above the surface) that were 1 to 3 degrees Celsius (2 to 5 degrees Fahrenheit) below the 1981 to 2010 average. Warm conditions prevailed over northern Siberia; temperatures there were as much as 4 to 5 degrees Celsius (7 to 9 degrees Fahrenheit) above average. A persistent area of low pressure between Hudson Bay and Baffin Island drove winds from the south over Greenland, which were responsible for several above-average temperature events in Greenland during the month.
August 2021 compared to previous years
The pace of ice loss for the month was much slower than in recent years but still near the average pace for the reference period of 1981 to 2010, leading to the tenth lowest August of the satellite data record. Through 2021, the linear rate of decline for monthly mean August sea ice extent is 10.4 percent per decade (Figure 3). This corresponds to 75,000 square kilometers (29,000 square miles) per year. The cumulative August ice loss over the 43-year satellite record is 3.15 million square kilometers (1.22 million square miles), based on the difference in linear trend values in 2021 and 1979. The loss of ice since 1979 in August is equivalent to about twice the size of the state of Alaska.
Buoy oh buoy
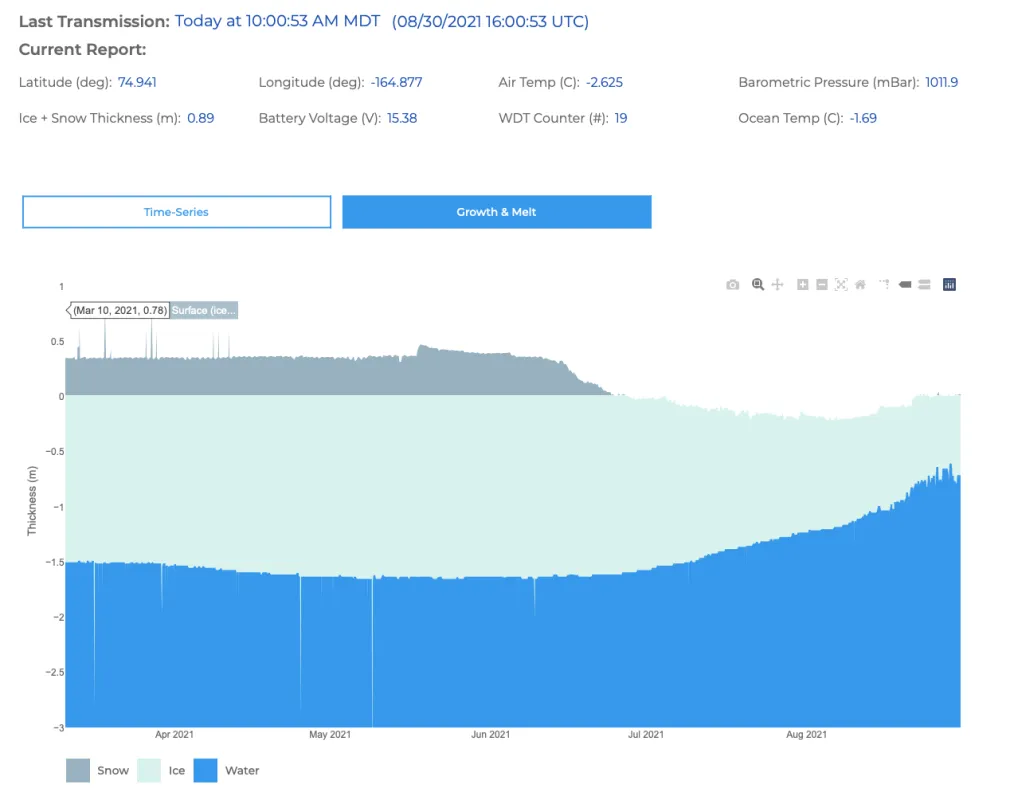
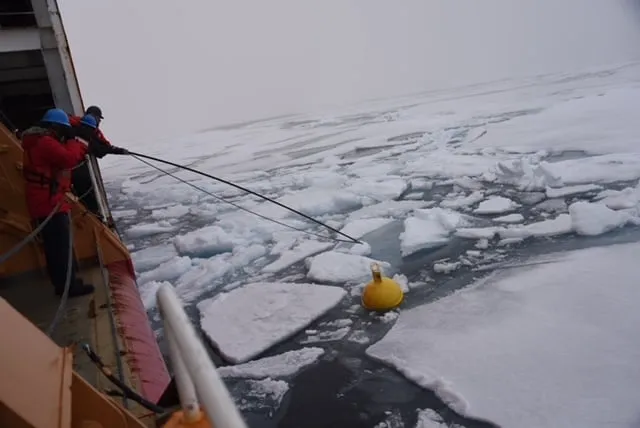
Ice mass balance (IMB) monitoring buoys drifting in the Arctic Ocean provide data on both surface melting and sub-surface thinning of the ice by warm ocean water. The IMB buoys include a downward-looking acoustic sounder above the ice to obtain snow depth on sea ice, temperature sensors (thermistor string) through the ice, and an upward-looking underwater acoustic sensor to measure the depth of the bottom of the ice. Putting these measurements together provides a profile of ice thickness and snow depth. Real-time data are provided, but are subject to errors. Data are later corrected to provide a high-quality climate record.
New buoys are regularly deployed to replace those that have ceased operation or have drifted out of the Arctic Ocean into the Atlantic. Data from one buoy in the Chukchi Sea off the northwest coast of Alaska is shown in Figure 4 for April through August. The data demonstrate that bottom ice growth continued into May. Surface snow melt started in June, and by July, bottom melt began in earnest. Surface freeze-up occurred in early August while bottom melt continued through mid-August. This is typical for sea ice—ocean heat continues to melt ice from the bottom (and sides) even as the surface air temperatures drop below 0 degrees Celsius (32 degrees Fahrenheit) and the top of the ice cover begins to refreeze. Overall, the ice thickness dropped from about 1.5 meters (4.9 feet) in late June to about 0.5 meters (1.6 feet). As of the end of August, thickening of the ice through bottom freezing has begun.
Northern passages
A persistent tongue of ice has remained along the coast of the Severnya Zemlya islands. However, ice has pulled away from the Siberian coast, opening a narrow channel with little or no ice. Regardless of the ice, there have been icebreaker-supported transits through the passage through the summer. And in fact, there was even a winter transit in January through February.
The Northwest Passage (NWP) through the channels of the Canadian Archipelago still has ice blocking all routes, although concentration and extent are low in some areas. Nevertheless, this past week, the U.S. Coast Guard icebreaker, the Healy, left port in Seward, Alaska, to begin a transit through the NWP. The mission is focused on conducting scientific research, including mapping of the seafloor and providing experience in navigating through the passage.
Icebergs in the Arctic Ocean
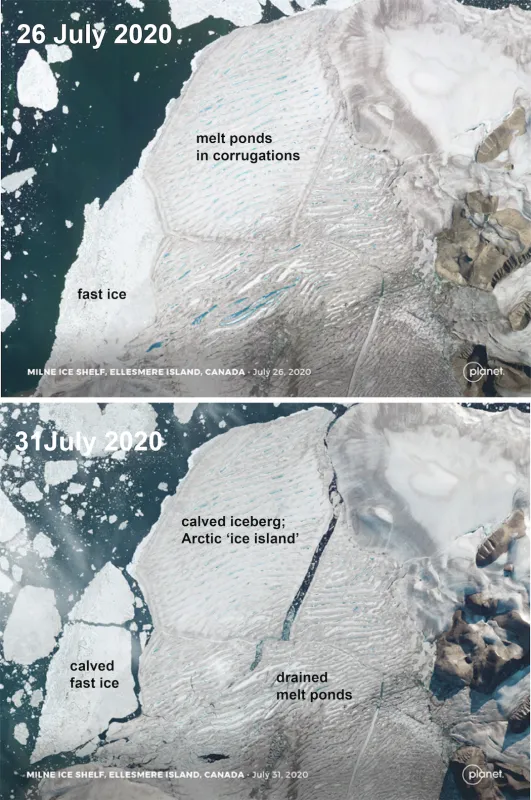
The break up of the Milne Ice Shelf in June 2020 spawned several tabular bergs that are now drifting in the Arctic Ocean (Figure 6). While not unprecedented, these ‘ice islands,’ as they were called in the 1950s, are now quite rare. The icebergs are a result of the calving retreat and demise of several small Arctic-style ice shelves (much smaller than Antarctic ice shelves) that formerly occupied several of the fjords along the northern coast of Ellesmere Island. Calving and loss of most of the Milne Ice Shelf (the setting for a work of fiction, “Deception Point” by Dan Brown) in late July 2020 marked the break-up of the last relatively intact ice shelf of a fringe of shelves that once spanned several thousand square kilometers along the Ellesmere coast. The Canadian Ice Service is tracking the bergs.
Antarctic Notes
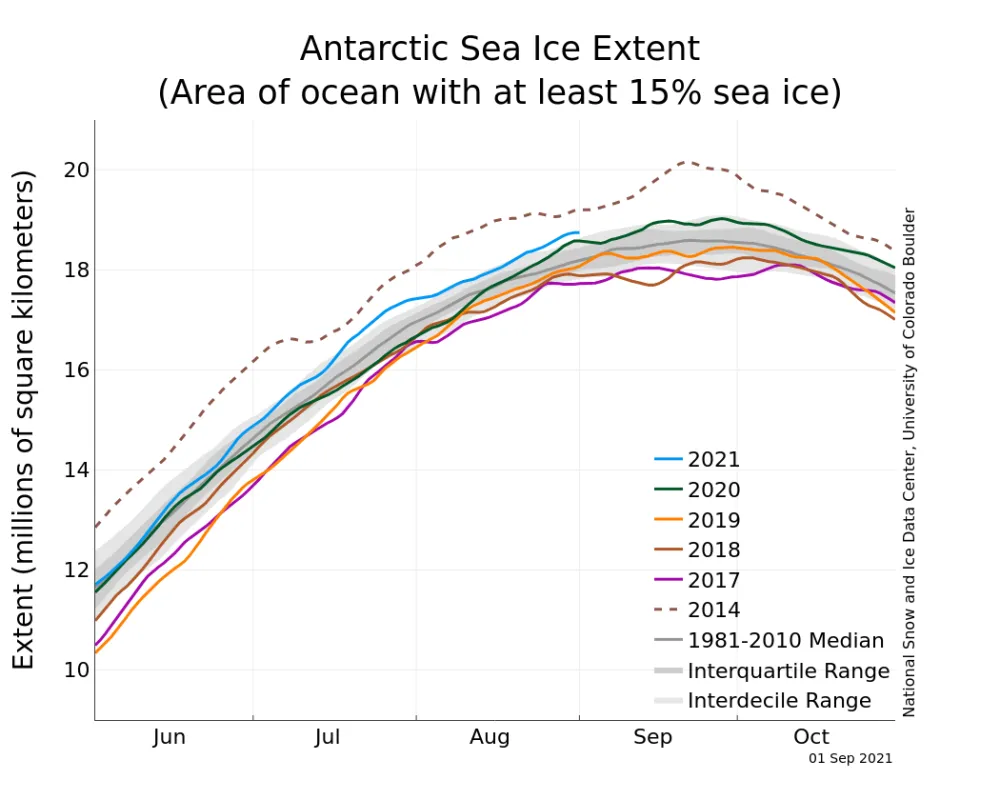
Sea ice in the Southern Ocean surrounding Antarctica was well above the 1981 to 2010 average extent in August, rising above the ninetieth percentile of the satellite record period near the end of the month (Figure 7). As of this post, Antarctic sea ice extent is fifth highest for the day in the satellite record, a sharp contrast from the several years of persistent below-average ice extent following an abrupt change in September 2016. Antarctica’s sea ice is highly variable. Sea ice extent is slightly above average in nearly all sectors, in particular in the Weddell and Cosmonaut Seas and the region north of eastern Wilkes Land.
Further Reading
Crary, A. P., R. D. Cotell, and T. F. Sexton. 1952. Preliminary Report on Scientific Work on “Fletcher’s Ice Island.” Arctic, 5(4), pp.211-223.
Koenig, L. S., K. R. Greenaway, M. Dunbar, and G. Hattersley-Smith. 1952. Arctic ice islands. Arctic, 5(2), pp.66-103.
Brown, D. 2001. Deception Point, Simon and Schuster, 372 pp.
