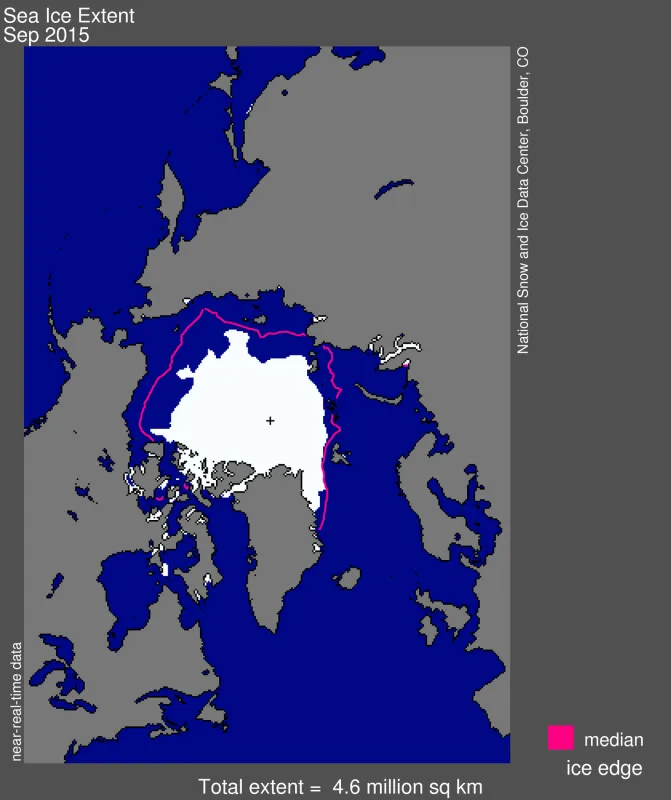
The Arctic melt season has ended and sea ice extent is now increasing after reaching the fourth lowest minimum on record, on September 11. Sea ice extent in Antarctica has not yet reached its seasonal maximum.
Overview of conditions
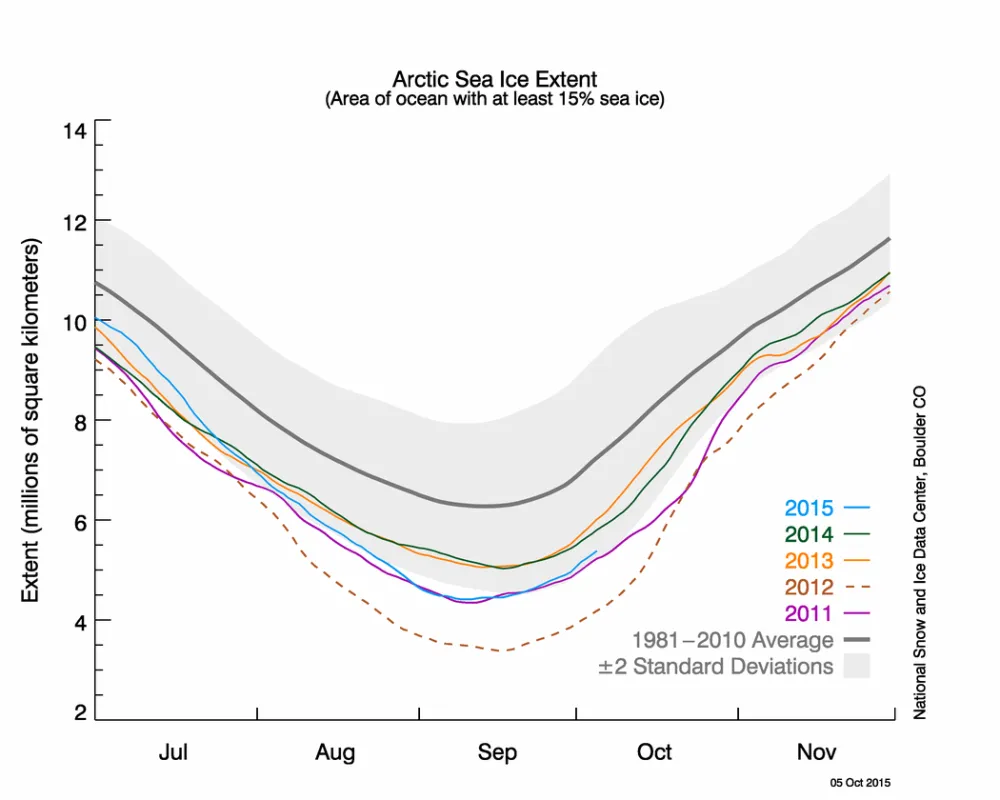
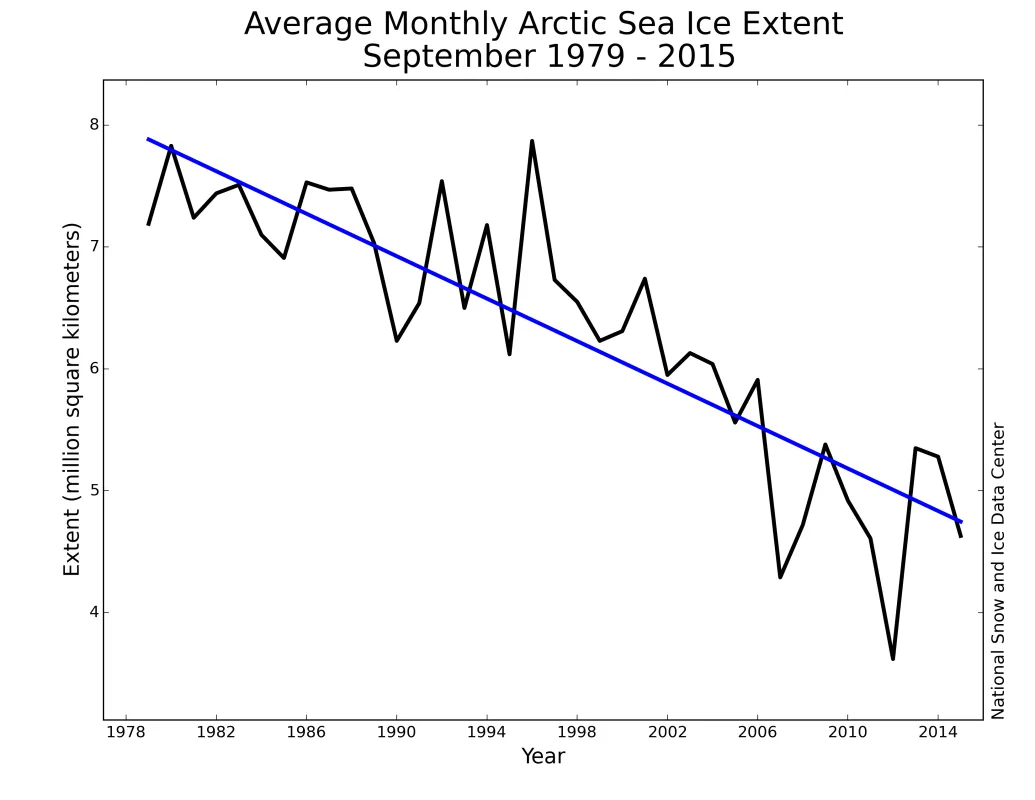
Following the seasonal daily minimum of 4.41 million square kilometers (1.70 million square miles) that was set on September 11, which was the fourth lowest in the satellite record, Arctic sea ice has started its cycle of growth. Arctic sea ice extent averaged for the month of September 2015 was 4.63 million square kilometers (1.79 million square miles), also the fourth lowest in the satellite record. This is 1.87 million square kilometers (722,000 square miles) below the 1981 to 2010 average extent, and 1.01 million square kilometers (390,000 square miles) above the record low monthly average for September that occurred in 2012. As of this writing, Antarctica’s winter maximum has not yet occurred, but is anticipated within several days.
Conditions in context
For two weeks following the minimum extent on September 11, air temperatures at the 925 hPa level (about 3,000 feet above the surface) were 2 to 4 degrees Celsius (4 to 7 degrees Fahrenheit) lower than average in the Chukchi and Beaufort seas, helping foster ice growth in those regions. Elsewhere over the Arctic Ocean, there has been fairly little ice growth, in part due to near average to slightly above average air temperatures. Both the Northern Sea Route and Roald Amundsen’s route through the Northwest Passage appeared to remain free of ice at the end of the month. The deeper northern route through Parry Channel, which consists of M’Clure Strait, Barrow Strait, and Lancaster Sound, never completely cleared of ice.
September 2015 compared to previous years
Through 2015, the linear rate of decline for September Arctic ice extent over the satellite record is 13.4% per decade. The nine lowest September ice extents over the satellite record have all occurred in the last nine years.
Conditions leading to this year’s minimum
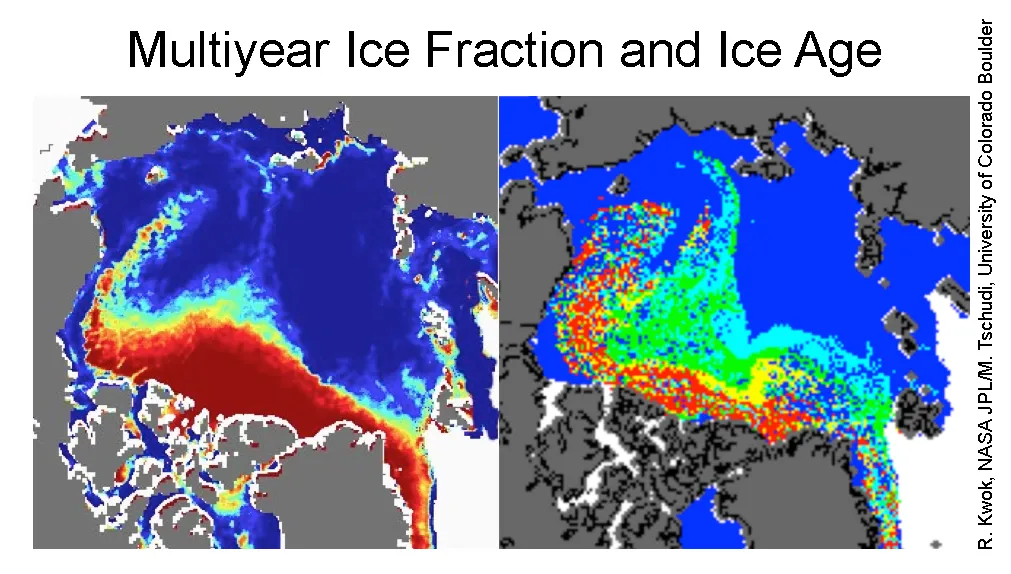
The summer melt season began earlier than average. The maximum winter extent, reached on February 25, 2015, was also the lowest recorded over the period of satellite observations. However, a relatively large amount of multiyear ice was transported into the southern Beaufort and Chukchi seas during the winter, as documented by images of multiyear ice fraction derived from the Advanced Scatterometer (ASCAT) instrument on the METOP-A satellite (Figure 4a). The corresponding ice age image shows that the multiyear ice largely consisted of floes that had survived several melt seasons, indicating that it was fairly thick. Thick ice is more difficult to melt out during summer than thinner ice; if not for this thicker ice, the September minimum extent would likely have been lower.
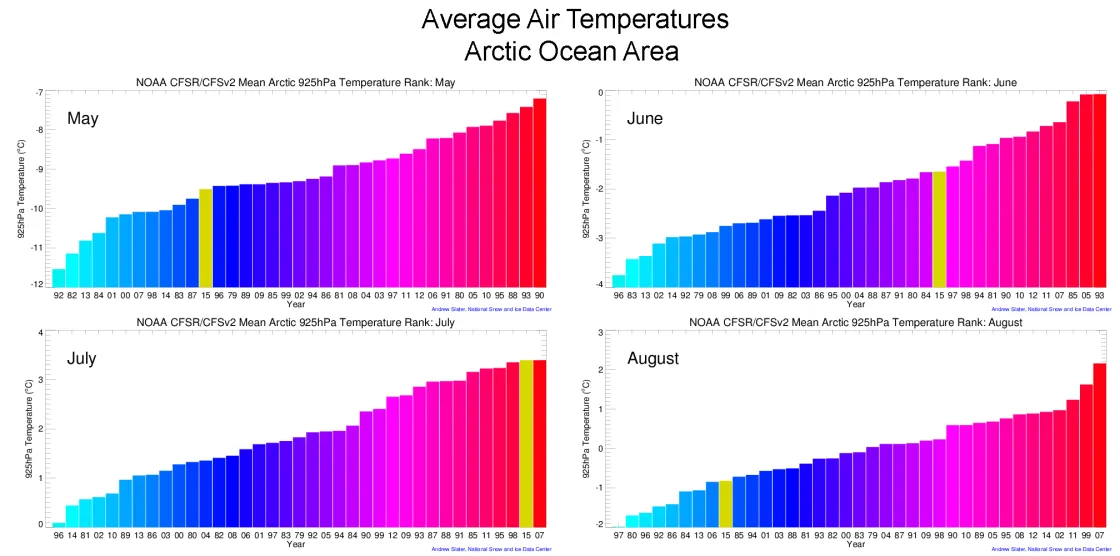
Melt onset began earlier than average in the Beaufort Sea, especially along the coast of Canada, leading to early development of open water in this area. Melt also began earlier than is usual in the Kara Sea, fostering early retreat of sea ice in the region. However, air temperatures at the 925 hPa level during May and June for the Arctic ocean region were not particularly high, ranking as the 26th and 13th warmest since 1979 (Figure 4b). As a result, although the winter maximum extent was the lowest in the satellite record, ice extent at the end of June was only the third lowest.
The pace of seasonal ice loss picked up rapidly in July, with Arctic ocean region temperatures at the 925 hPa level reaching the second highest during the satellite record (with 2007 ranked as the highest). Daily ice loss rates averaged 101,800 square kilometers (39,300 square miles) per day, the fourth largest rate of ice loss recorded for the month. Nevertheless, sea ice was slow to melt out of Baffin Bay and Hudson Bay, resulting in a July average extent for 2015 that was the eighth lowest on record. By the end of July however, the fast pace of ice loss during the month resulted in 2015 extent falling within 550,000 square kilometers (212,000 square miles) of the level recorded in 2012, and tracking below the levels recorded for 2013 and 2014. By the middle of August, the difference in extent between 2012 and 2015 had dropped to less than 500,000 square kilometers (193,000 square miles), hinting at the possibility that this year would rank among the lowest minimum extents recorded. However, temperatures for August were not particularly warm, and extent ended up fourth lowest.
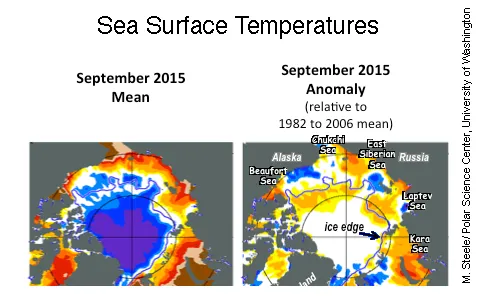
Higher than average Arctic sea surface temperatures dominated the Arctic Ocean in September 2015 (Figure 4c), though not as high as seen in 2007 or 2012. Early melt onset as well as strong spring winds in the eastern Beaufort Sea led to early ice retreat in this area (Steele et al., 2015). These winds were particularly strong in April 2015, but then they abated, so that while the resulting summer sea surface temperatures were higher than surrounding waters, they were only around 2 to 3 degrees Celsius (4 to 5 degrees Fahrenheit) higher than average near the coast. The Kara Sea was also unusually warm this year, while sea surface temperatures were generally lower than average in the Nordic seas.
What happened to the old ice in the Beaufort and Chukchi Seas?
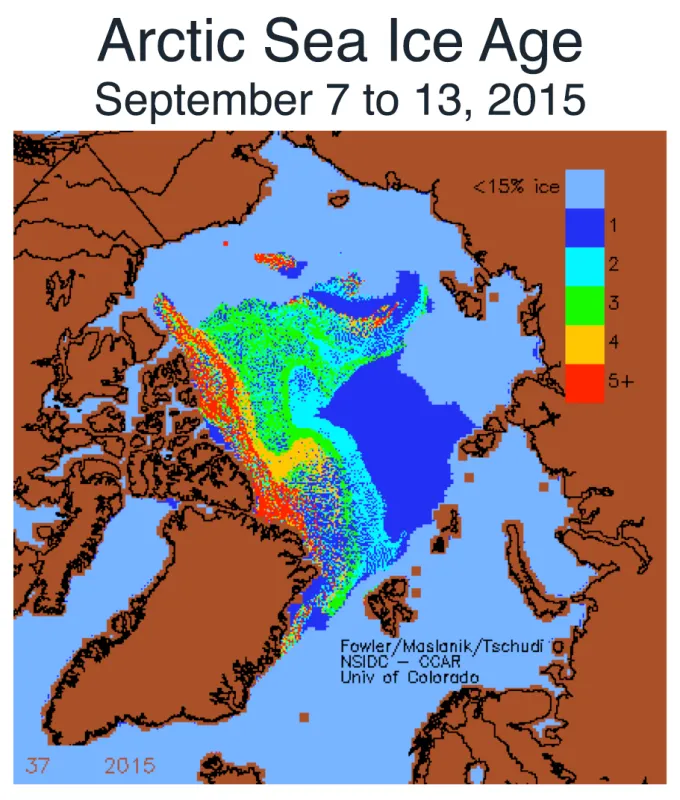
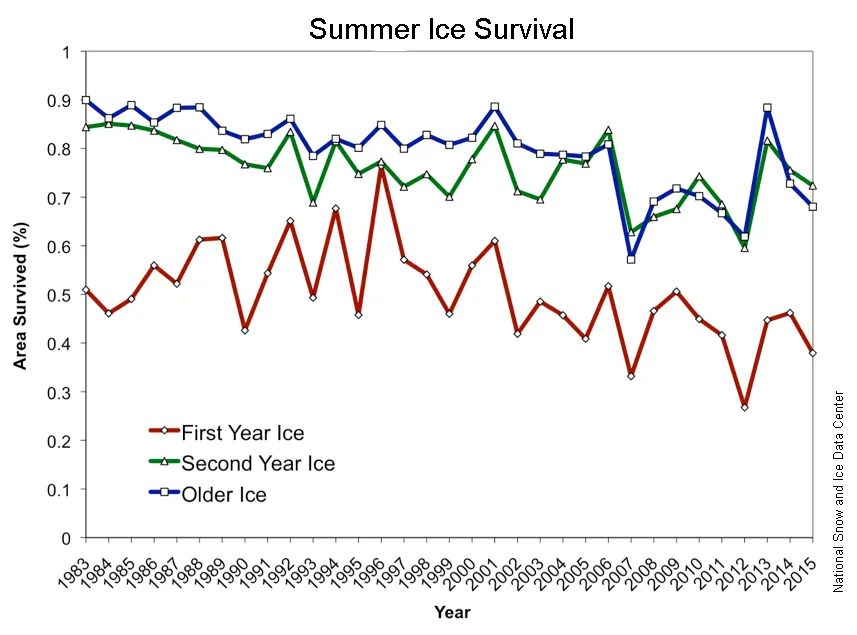
Maps of ice age at the beginning of the melt season and at the time of the September minimum extent (Figure 5a) reveal that most of the old ice transported into the southern Beaufort and Chukchi seas melted out this summer. This resulted in a 31% depletion of the multiyear ice cover this summer for the Arctic as a whole, compared to only 12% in 2013 and 38% in 2012. There was also more first-year ice lost this summer than during the last two summers. Sixty-two percent of the winter first-year ice was lost. Overall, this was the third largest amount of first-year ice lost in a melt season, behind 2012 (73%) and 2007 (67%).
References
Steele, M., S. Dickinson, J. Zhang, and R. Lindsay. 2015. Seasonal ice loss in the Beaufort Sea: Toward synchrony and prediction, J. Geophys. Res., 120, doi:10.1002/2014JC010247.
Erratum
A reader alerted us that Figure 5a was mislabeled. Instead of Mid-March 2015, it should have been labeled September 2015. On October 8, 2015, we corrected the label and its caption.
