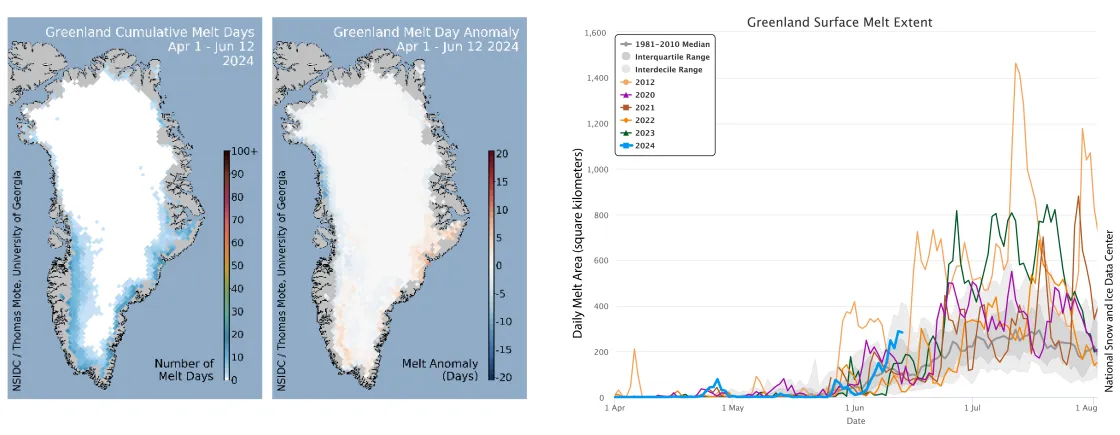
On April 25, 2024, a moderately strong melt event kicked things off early on the Greenland Ice Sheet. Since then, however, the melt season has been fairly typical. Snowfall in early June blanketed exposed ice, which will slow the onset of more intense melting and run off for the next few weeks. Overall, melting in Greenland has remained well above the 1980s and 1990s levels since 2013, but the 2012 season remains a distinct record.
Overview of conditions
Melting so far this year on the Greenland Ice Sheet has been moderate compared to recent years, just slightly above the 1981-to-2010 average in the 46-year satellite record. Regionally, the number of surface melt days has been a few days above average along the eastern coast, and southern tip of the island, and several days below average along the northwestern coast (Figure 1). Beginning around June 5, steady melting has occurred on the southern part of the ice sheet, on both the east and west coasts. Total melt area is still well below any daily record in this period. The early melt event on April 25 covered the far southern tip of the island.
Conditions in context
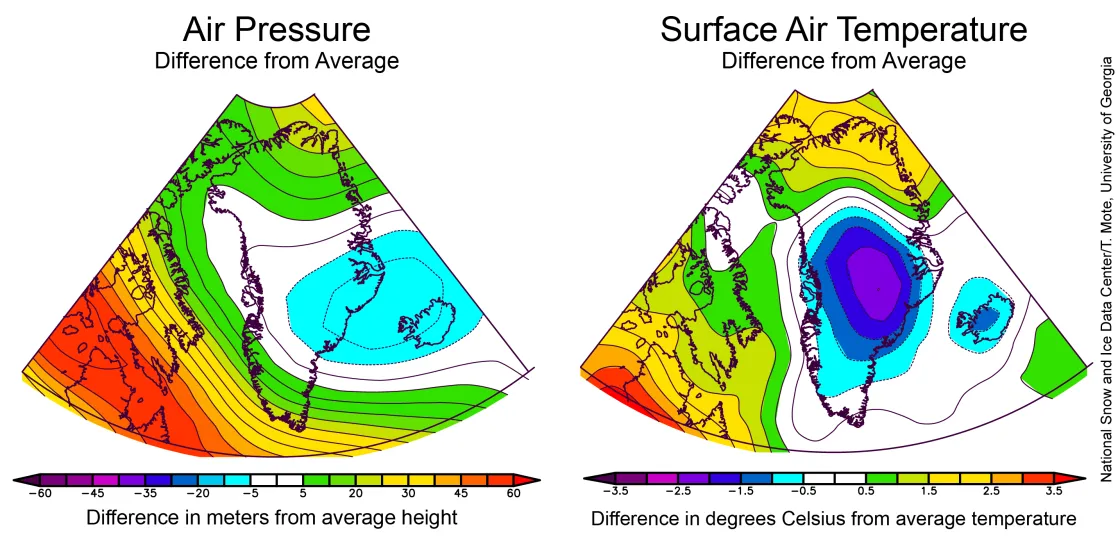
Temperatures have been generally below average over Greenland through the early part of the melt season, with slightly above average temperatures along the northern coast of the island (Figure 2a). Central Greenland has been 2 to 3 degrees Celsius (4 to 5 degrees Fahrenheit) below the 1991-2020 average, while the northern coast has been about 2 degrees Celsius (4 degrees Fahrenheit) above average. This is related to the average air pressure and resulting wind pattern over the island. Below average pressure over the eastern coast, and high pressure over Hudson Bay and Labrador, has moved Arctic air over the center of the island, but has drawn warmer north Atlantic air over the northern coastline (Figure 2a).
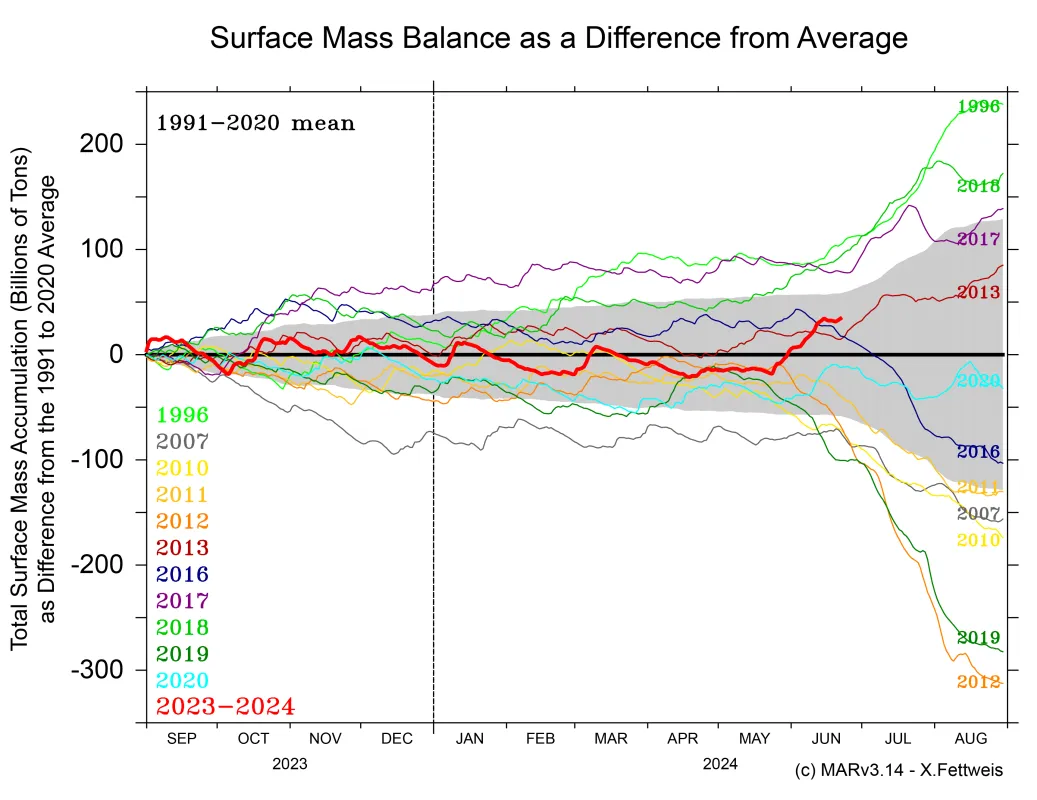
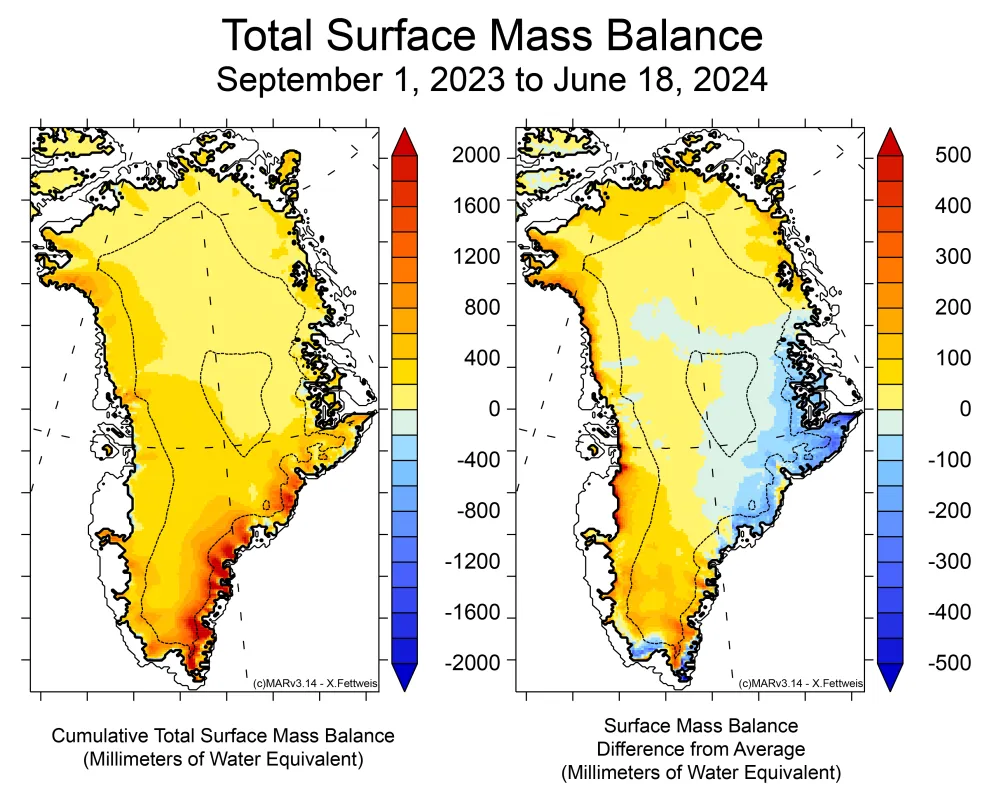
Net snow accumulation (total snow and rain, minus evaporation and run-off of melt) has been mostly above average all autumn and winter, and a late snowfall event in early June has added fresh snow to the snowpack at the start of the melt season (Figure 2b). The late snow cover is along the south and west coast, extending northward and over the northern third of the island (Figure 2c). Particularly for the southwestern coast, this late snow will delay the emergence of darker, older ice, and therefore delay increased melting and runoff over this dark surface.
Has seasonal melting slowed in Greenland?
Greenland melting reached an extreme maximum in the summer of 2012, far surpassing anything that had been seen in the satellite record or in any historical observations at that time. In that single year, nearly every part of the Greenland Ice Sheet saw significant surface melting, even high-elevation areas that had been assumed to be permanently free of surface melting. This was referred to as the dry snow zone in the late 1960s.
Since 2012, melting of the Greenland Ice Sheet has been variable, but generally still above the levels seen in the 1980s and 1990s. Over the period from 2013 to 2023, or 11 seasons, all but 3,250 square kilometers (1,250 square miles) of the ice sheet have melted again, including the highest part of the ice sheet at Summit station. Still, particularly cool seasons in 2013 and 2017 saw a return to those twentieth century conditions. On average since 2012, there has been slightly less melting than the 11 years before 2012 (2001 to 2011), but no statistical trend has emerged.
Ice art III
On June 9, glaciologist Jason Box took this photo of the fjord north of the Nussuaq Peninsula in west-central Greenland, near the town of Uummannaq.
Further reading
Benson, C. S. .1960. Stratigraphic Studies in the Snow and Firn of the Greenland Ice Sheet. Dissertation (Ph.D.), California Institute of Technology. doi:10.7907/G7V2-0T57.
Fahnestock, M., R. Bindschadler, R. Kwok, and K. Jezek. 1993. Greenland ice sheet surface properties and ice dynamics from ERS-1 SAR imagery. Science, 262 (5139), pp.1530-1534, doi:10.1126/science.262.5139.1530.


