Autumn over the Arctic Ocean is a season of falling temperatures and rapid growth of sea ice. However, as in recent years, low sea ice extent at the beginning of autumn means large transfers of heat to the atmosphere from open water areas, keeping the Arctic warmer than usual. Despite this warmth, freeze up is in high gear.
Overview of conditions
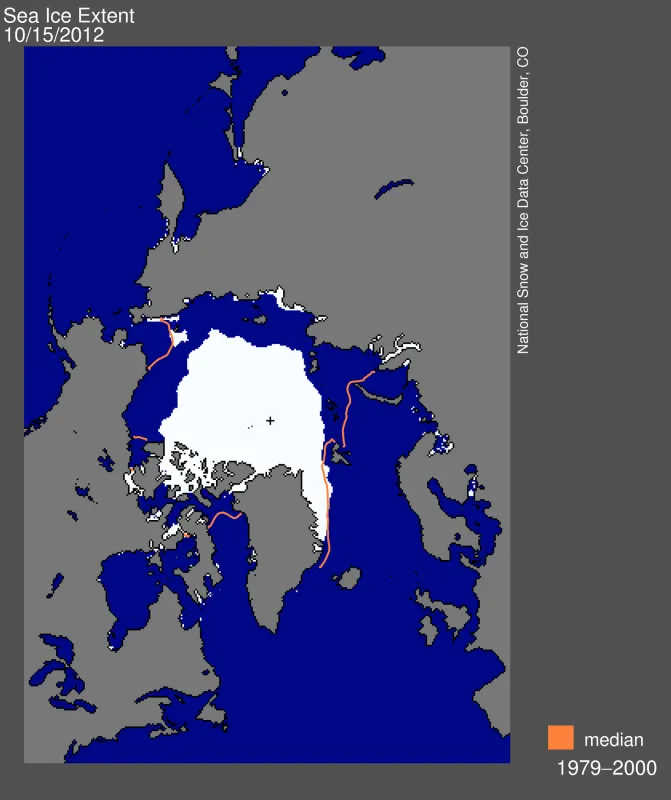
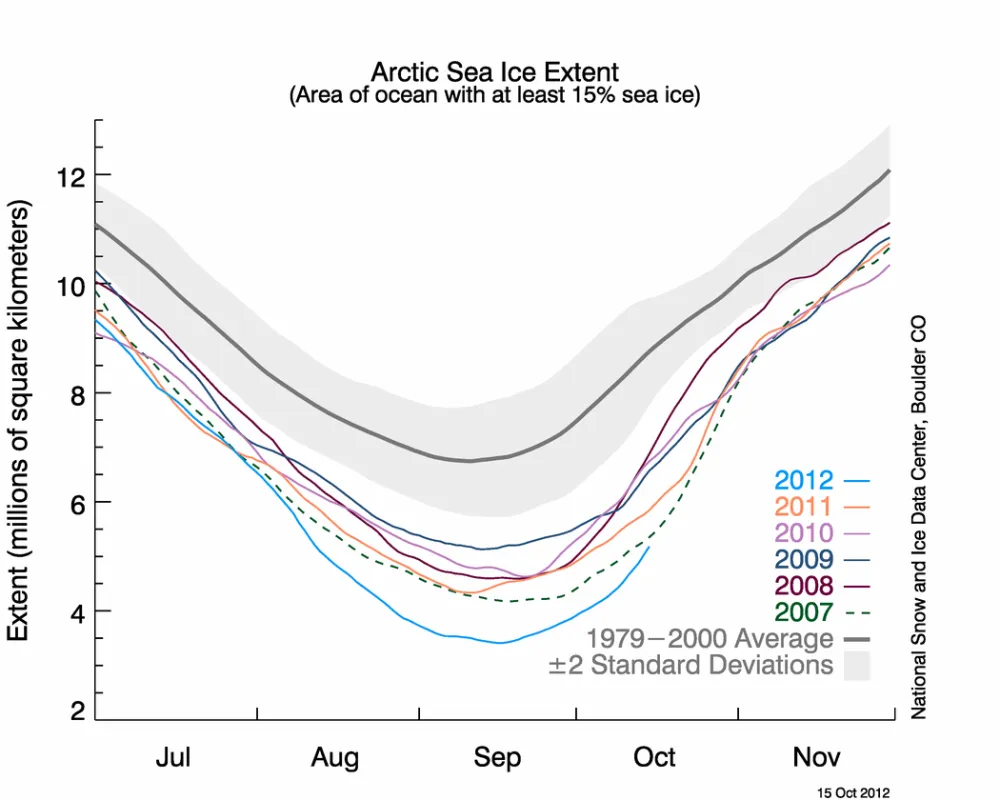
As of October 15, sea ice extent stood at 5.18 million square kilometers (2.00 million square miles). This is 3.49 million square kilometers (1.35 million square miles) below the 1979 to 2000 mean for this time of year and 70,000 square kilometers (27,000 square miles) below the same date in 2007. Although it is still at record low levels, extent is climbing fast.
Large areas of the Kara, Laptev, East Siberian, Chukchi, and Beaufort seas remain open for hundreds of kilometers offshore. East of Greenland, ice extent is near average.
Conditions in context
Arctic sea ice extent is increasing rapidly, at about 100,000 square kilometers (38,600 square miles) per day, expanding southward at the ice edge, as well as northward from the Arctic continental coasts. However, sea ice extent is still at record low levels for the date, compared to the satellite measurement period (1979 to 2012). On October 6, daily sea ice extent climbed above the 2007 record daily minimum (4.17 million square kilometers or 1.61 million square miles), having spent forty days below that level. On October 14, extent went above 5.0 million square kilometers (1.93 million square miles) for the first time since mid-August.
Open water warms the lower atmosphere
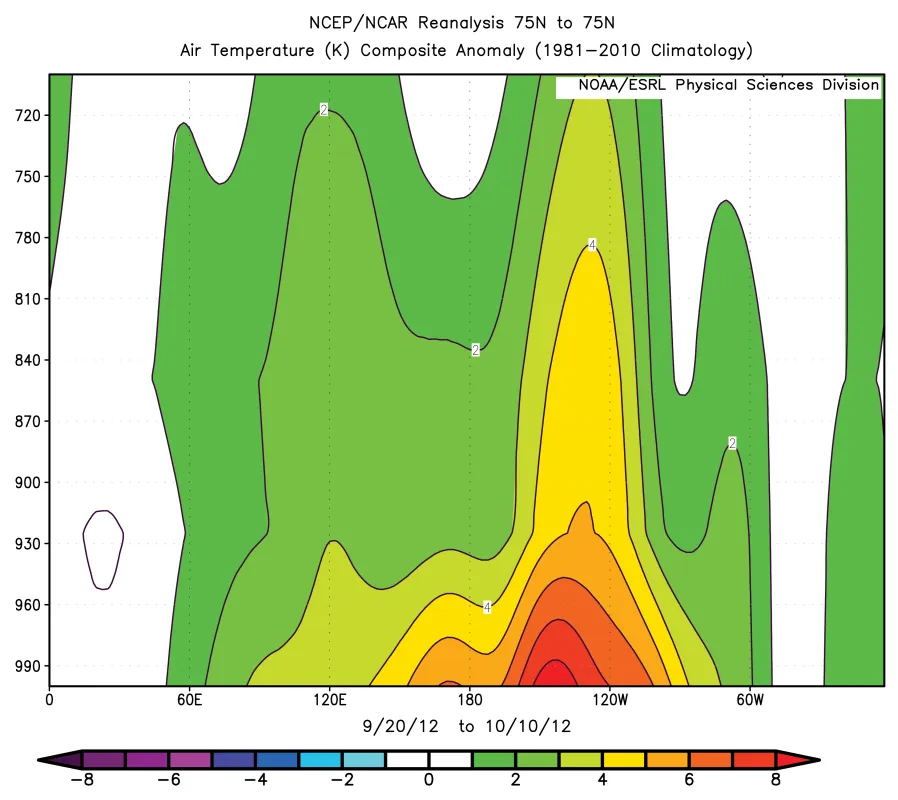
The past decade has seen much stronger increases in air temperature in the Arctic compared to the globe as a whole. While this strong warming, known as Arctic amplification, has a number of causes, a primary one is declining summer sea ice extent. Through summer, solar energy is readily absorbed within expanding areas of dark, open water. When the sun sets, this heat stored in the uppermost layers of the Arctic Ocean is released upwards, keeping the overlying atmosphere unusually warm.
This warming effect has been especially pronounced during the early autumn of 2012. Air temperatures averaged over the most recent thirty days of data are above average over nearly all of the Arctic Ocean. The warmest conditions compared to average are over northwestern Canada and extending into the Beaufort Sea. Here, the effect of heat released from the ocean is augmented by warm, southerly winds, and is linked to a pattern of unusually high pressure centered over the Gulf of Alaska.
Arctic wind patterns support melting, ice export
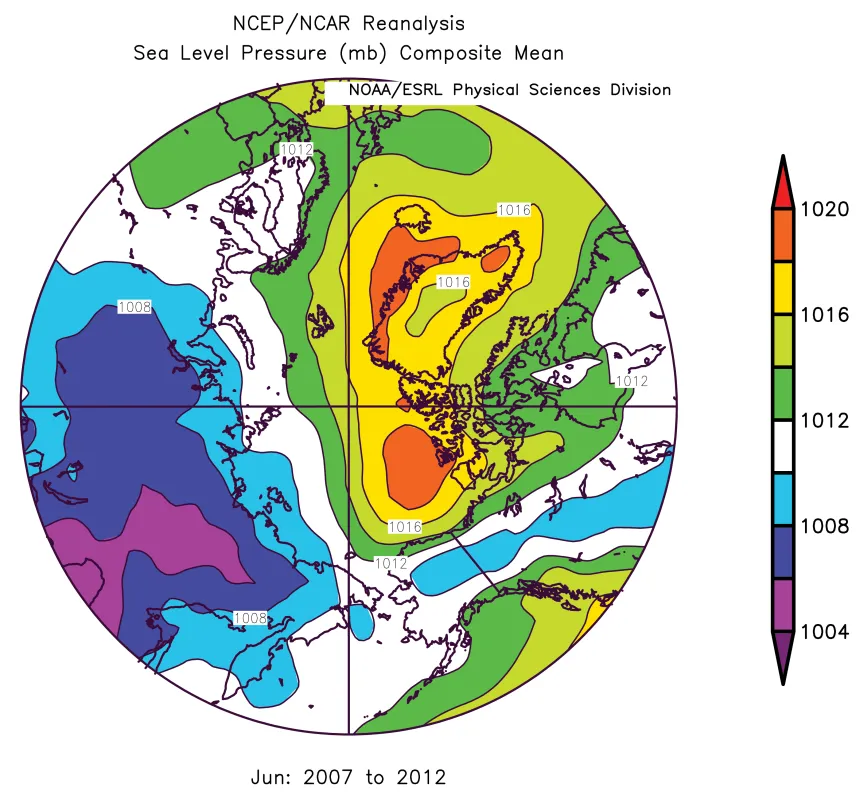
Recent research led by James Overland of the National Oceanic and Atmospheric Administration (NOAA) and Jennifer Francis of Rutgers University shows that the Arctic dipole anomaly, featuring unusually high pressure over the northern Beaufort Sea and Greenland and unusually low pressure over northeastern Eurasia, has become more common in the early summer of recent years.
As discussed in previous posts, this pattern brings in warm southerly winds along the shores of the East Siberian and Chukchi seas. It favors strong ice melt in these sectors and pushes the ice away from the coast, leaving open water. The pressure pattern also favors the transport of ice out of the Arctic Ocean and into the North Atlantic through Fram Strait.
The Arctic dipole anomaly was very well developed throughout the summer of 2007 and was in part responsible for the very low September ice extent recorded that year (the second lowest in the satellite record). According to Overland and colleagues, no other six-year period matches the intensity and persistence of the June pattern for 2007 to 2012 in the past sixty-three years. The pattern is linked to the general weakening of the circumpolar jet stream and the greater meandering of this wind flow.
Recall from our previous post that the summer of 2012 as a whole saw a somewhat different pattern. Unusually low pressure was present along the Eurasian coastal seas and extended eastward into the Beaufort Sea, most prominently over the East Siberian Sea, with unusually high pressure centered over Greenland and the northern North Atlantic.
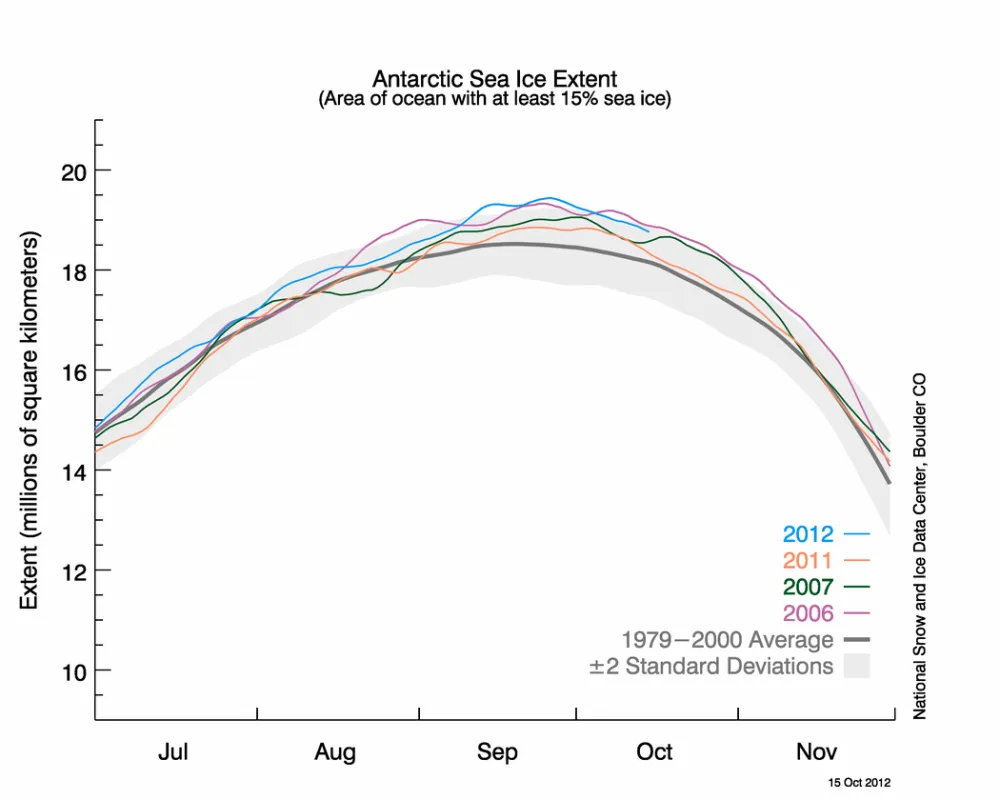
Antarctic sea ice extent remains above average
Antarctic sea ice extent dropped below record levels seen for the date but remains well above average. Journalists inquired about the cause of gradual growth in wintertime Antarctic sea ice and the record high Antarctic sea ice extent in mid-September despite general climate warming and the dramatic sea ice losses in the Arctic. As we noted in the previous post, researchers cite stronger westerly winds surrounding Antarctica, in contrast to the Arctic. See also the following news stories on Antarctic sea ice, to which NSIDC scientists contributed, under “Further reading” below.
Further reading
Peter Aldhous, “Why sea ice records are poles apart,” New Scientist, October 8, 2012.
Justin Gillis, “Running the numbers on Antarctic sea ice,” New York Times Green blog, October 3, 2012.
Richard Harris, “Scientists watch Antarctica, Arctic sea ice levels,” National Public Radio Morning Edition, October 8, 2012.
Reference
Overland, J. E., J. A. Francis, E. Hanna, and M. Wang. 2012. The recent shift in early summer Arctic atmospheric circulation. Geophysical Research Letters 39, L19804 https://doi.org/10.1029/2012GL053268
