The sun has set over the central Arctic Ocean and sea ice extent is now increasing. While much attention has been paid to the record minimum Arctic ice extent set on September 16, 2012, winter sea ice extent in Antarctica has reached a record high. The Antarctic extent increase is an interesting response to changes in circulation patterns in the Southern Hemisphere.
Overview of conditions
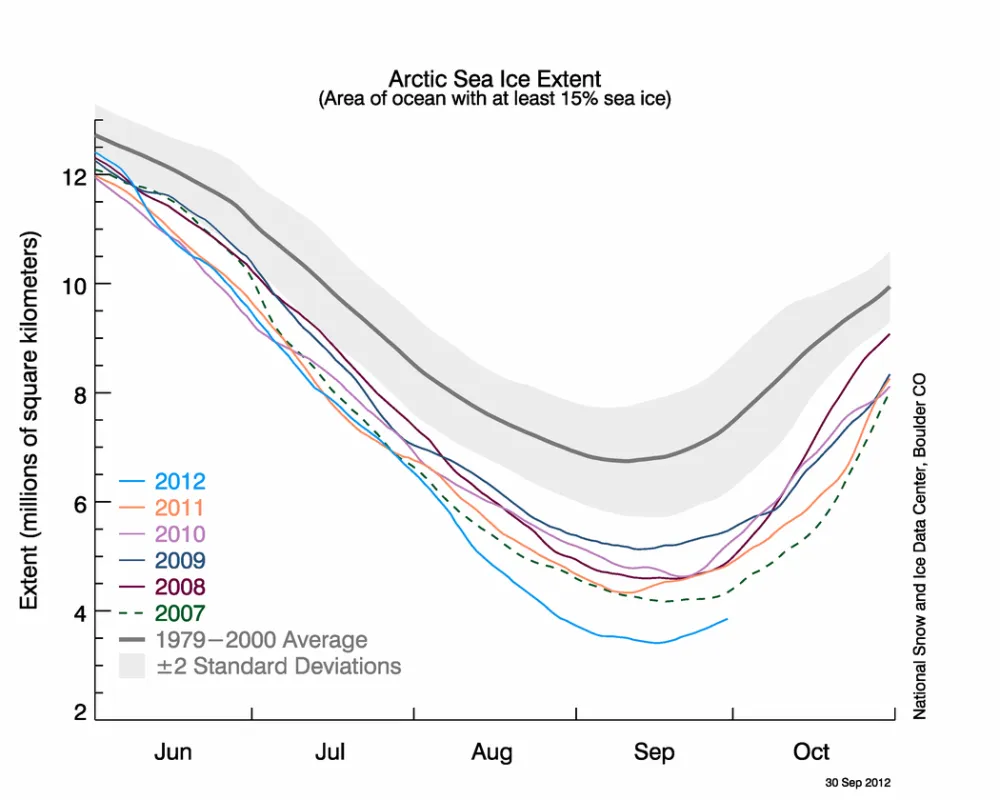
Following the record minimum that was set on September 16, 2012, Arctic sea ice has started its seasonal pattern of growth; maximum seasonal extent is expected to be reached by the end of March of next year.
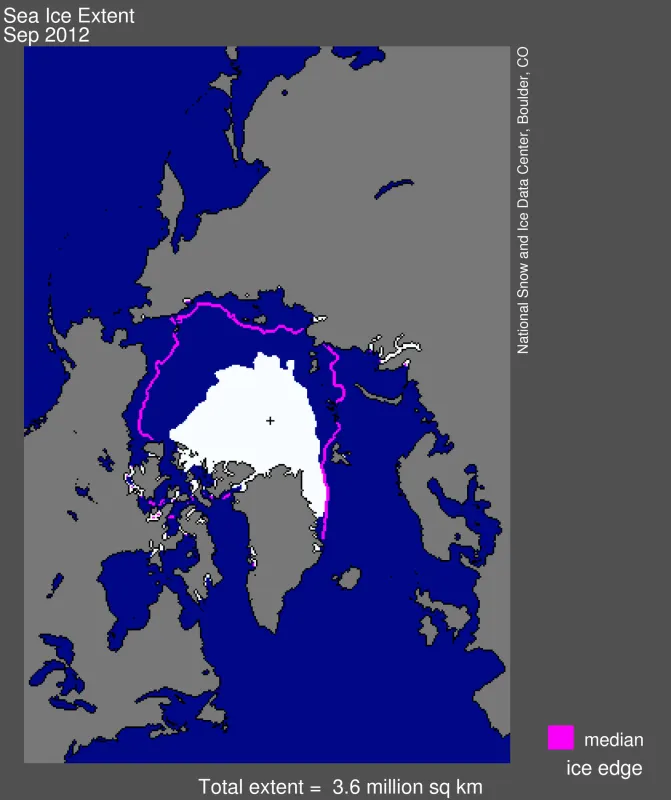
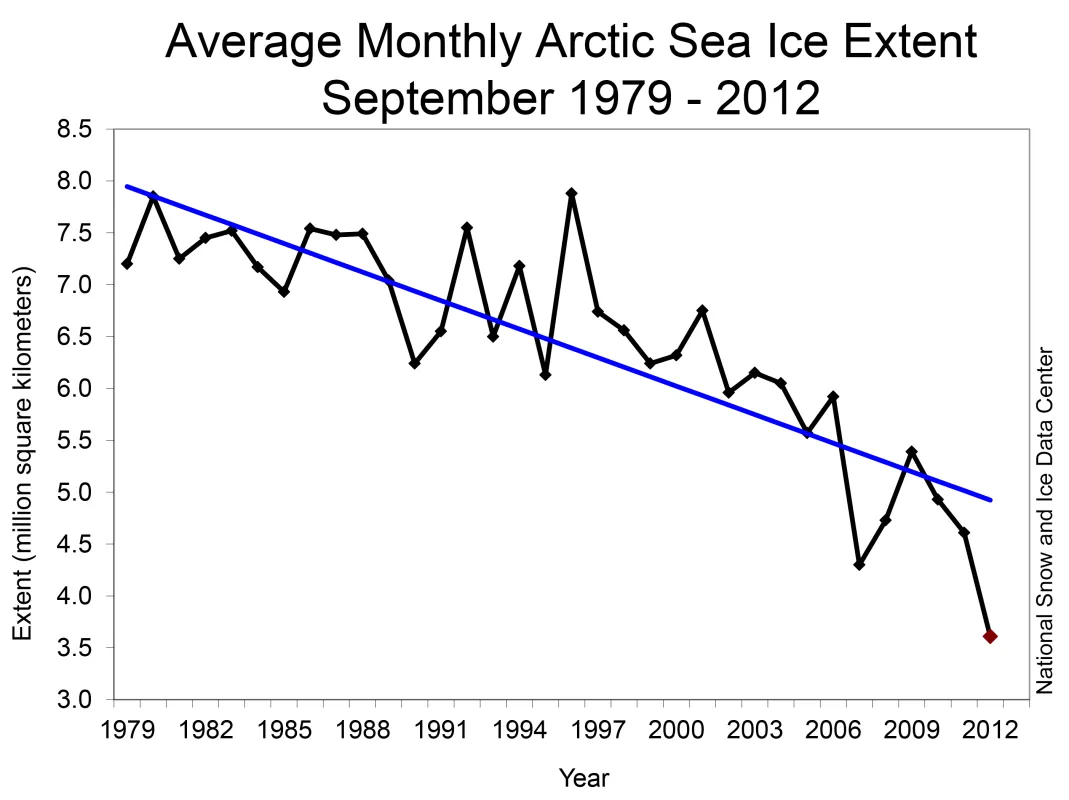
Arctic sea ice extent averaged for September 2012 was 3.61 million square kilometers (1.39 million square miles). This was 3.43 million square kilometers (1.32 million square miles) below the 1979 to 2000 average extent. September 2012 ice extent was 690,000 square kilometers (266,000 square miles) less than the previous record low for the month that occurred in 2007.
Conditions in context
The seasonal minimum in extent that occurred this year on September 16 was three days later than the average date of the minimum (September 13). Because ice extent falls through the first part of September and rises in the latter part, statistics on the average daily rate of ice loss or gain through the month are largely meaningless. More relevant is the total ice loss through the melt season. Between the seasonal maximum extent that occurred on March 20, 2012 and the September 16 minimum, the Arctic Ocean lost a total of 11.83 million square kilometers (4.57 million square miles) of ice; this is by far the largest seasonal loss of sea ice in the satellite record. The second largest seasonal loss was 10.65 million square kilometers (4.11 million square miles), in 2008. Due in part to transfers of heat from extensive open water areas to the atmosphere, air temperatures at the 925 hPa level averaged for September 2012 were from 2 to 5 degrees Celsius (4 to 9 degrees Fahrenheit) above average over much of the Arctic Ocean; much larger departures from average were the rule at levels closer to the surface.
September 2012 compared to previous years
Arctic sea ice extent averaged for September 2012 was the lowest in the satellite record, and was 16% lower than the previous low for the month, which occurred in 2007. Through 2012, the linear rate of decline for September Arctic ice extent over the satellite record is now 13.0% per decade, relative to the 1979 to 2000 average. The six lowest September ice extents over the satellite record have all occurred in the last six years. Compared to the 1979 to 2000 average ice conditions, the September 2012 ice cover represents a 49% reduction in the area of the Arctic Ocean covered by sea ice. It is 2.91 million square kilometers (1.12 million square miles), or 45%, below the 30-year average over 1981 to 2010.
Summer weather conditions: 2012 compared to 2007
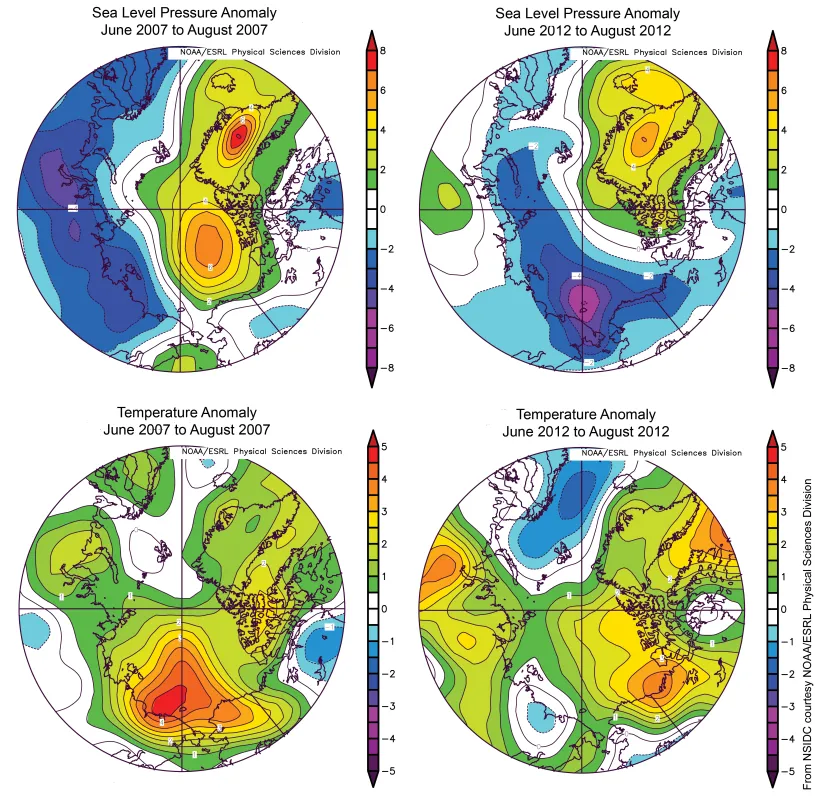
Weather conditions prevailing over the summer of 2012 were quite different from those in 2007. The summer of 2007 featured unusually high sea level pressure centered north of the Beaufort Sea and Greenland, and unusually low pressure along northern Eurasia, bringing in warm southerly winds along the shores of the East Siberian and Chukchi seas (3 to 5 degrees Celsius, or 5 to 9 degrees Fahrenheit above normal), favoring strong ice melt in these sectors and pushing the ice away from the coast, leaving open water. The pressure pattern also favored the transport of ice out of the Arctic Ocean and into the North Atlantic through Fram Strait.
In contrast, the summer of 2012 saw unusually low pressure along the Eurasian coastal seas and extending eastward into the Beaufort sea, most prominently over the East Siberian Sea, with unusually high pressure centered over Greenland and the northern North Atlantic. Air temperatures for summer 2012 were above average over most of the Arctic Ocean (1 to 3 degrees Celsius, or 2 to 5 degrees Fahrenheit), most prominently over the Beaufort Sea, where, because of the pressure pattern, winds were anomalously from the south. Melt began two to three weeks earlier than average in the Barents and Kara seas, leading to earlier retreat of sea ice in the region; however, air temperatures remained below average during summer in this region. This points to the impact the continued loss of old, thick ice is having on the ability of the sea ice cover to survive summer melt. Other than the August storm, the pressure pattern in 2012 does not appear to have been as favorable in promoting ice loss as was the case in 2007, and yet a new record low occurred.
Old, thick ice dwindles; young, thin ice prevails
Entering the melt season, a thinner ice cover made the Arctic sea ice cover more vulnerable to weather, such as the storm that tracked through the Arctic in early August. Because the ice was thin and already decaying by the time of the storm, it was quickly broken up and melted by winds and waves.
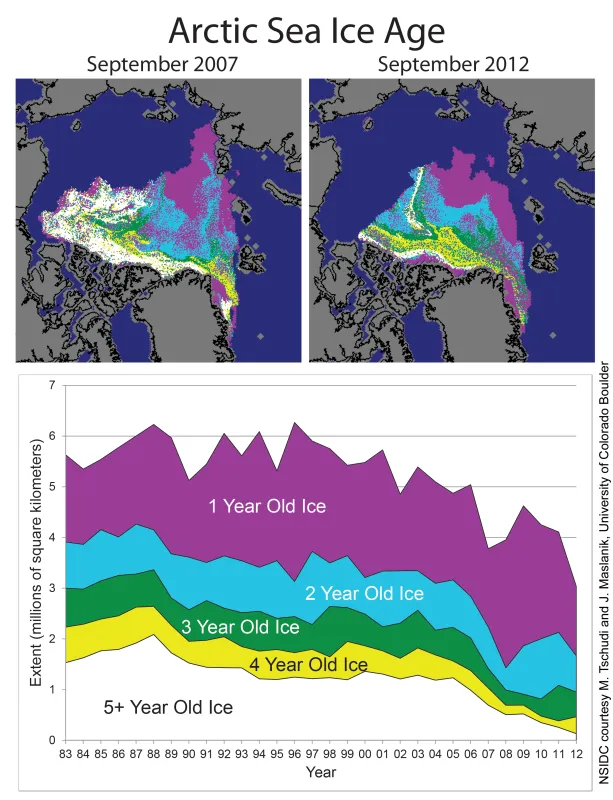
The end-of-summer sea ice cover was not only the least extensive in the satellite record, but also very likely the lowest volume, based on combined model-observation estimates from the University of Washington, and inferred from ice age. The extent of ice of nearly all age categories declined from last year and remained at record low levels. The only category that increased was 4-year-old ice. This is ice that has aged since the previous record low minimum extent in 2007, when substantial amounts of first-year ice were lost. This 4-year-old ice will now age into the 5+ year category as the ice-growth season begins. However, even with this replenishment this winter will see only approximately 20% of the old (5+ year) ice compared to the 1980s. Because of the record summer ice loss, this winter will see the Arctic Ocean region even more dominated by the thinner first-year ice. As shown in Figure 5, the amount of ice in nearly all age categories has decreased since 2007, particularly the oldest ice.
For more information and visualizations of thinning sea ice, see the NOAA Climate Watch article, “Arctic Sea Ice Getting Thinner, Younger.”
A view towards the south
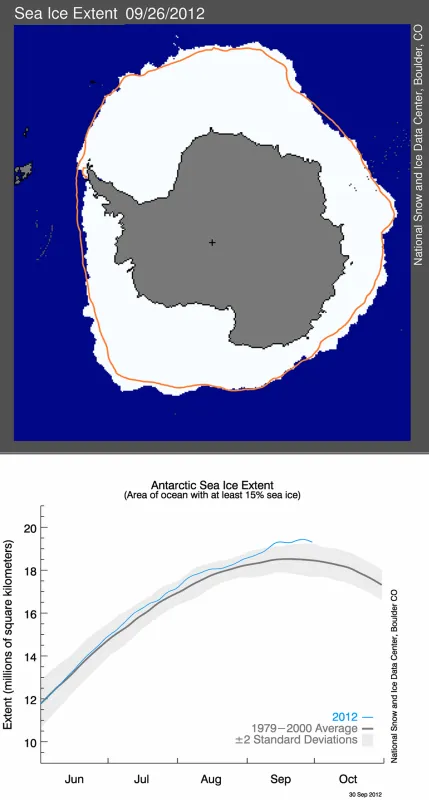
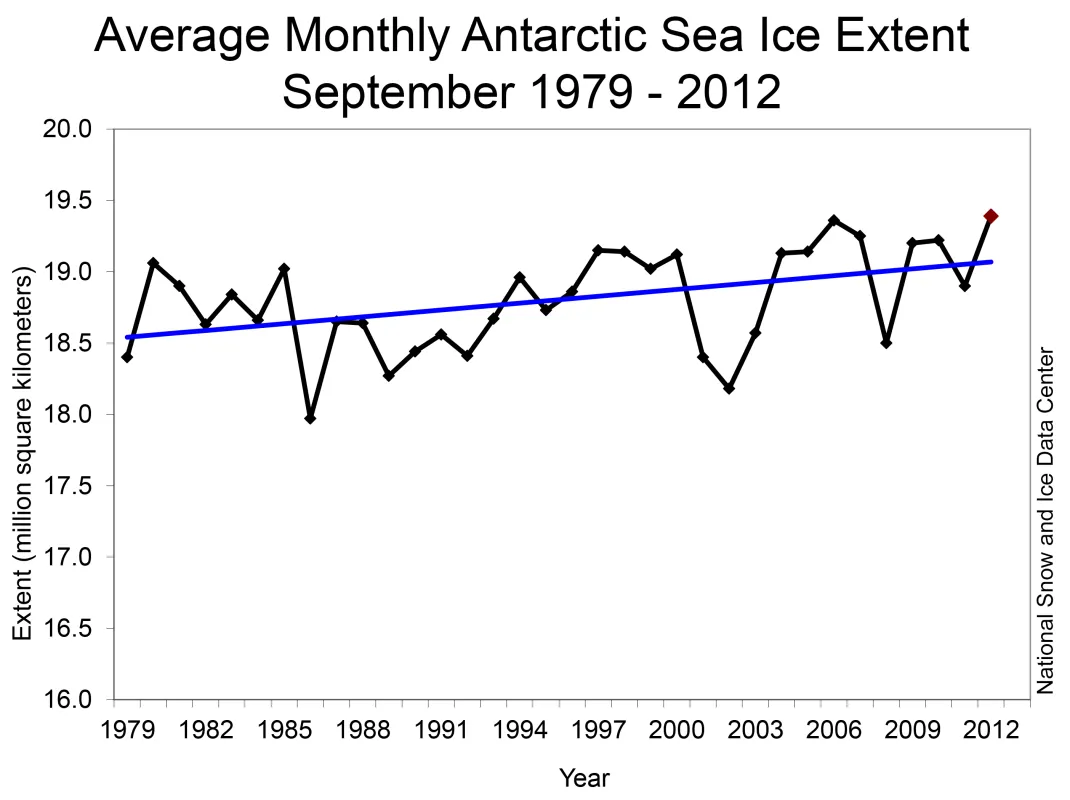
As the Arctic was experiencing a record low minimum extent, the Antarctic was reaching record high levels in the satellite record, culminating in a winter maximum extent of 19.44 million square kilometers (7.51 million square miles) on September 26. The September 2012 monthly average was also a record high, at 19.39 million square kilometers (7.49 million square miles) slightly higher than the previous record in 2006.
The September extent trend for 1979 to 2012 is just above the statistical significance level (0.9% per decade, plus or minus 0.6%). The new Antarctic sea ice September value is slightly greater than typical year-to-year variations, and is roughly equal to a 25 mile (40 kilometer) northward shift in the location of the ice edge relative to the 1979 to 2000 average. The trend for ice extent growth during Antarctic winters is about 16,000 square kilometers per year (6,200 square miles) or roughly an area the size of Connecticut. In comparison, the decline in Arctic summer sea ice extent is an area about the size of Indiana (91,600 square kilometers per year, or about 35,400 square miles).
Our colleague, Dr. Sharon Stammerjohn of INSTAAR, University of Colorado, provides a review of the differences between Arctic and Antarctic climate controls on sea ice and helps place the events in context. First, climate is warming over much of the Antarctic continent, as shown in several recent studies (e.g., Chapman and Walsh, 2007, Monaghan et al., 2008, Steig et al., 2009) and is related to Pacific Ocean warming (Ding et al., 2010) and circumpolar winds. Both warming and ozone loss act to strengthen the circumpolar winds in the south. This is due primarily to persistently cold conditions prevailing on Antarctica year-round, and a cold stratosphere above Antarctica due to the ozone hole. Stronger winds generally act to blow the sea ice outward, slightly increasing the extent, except in the Antarctic Peninsula region, where due to geography, winds from the north have also increased, pushing the ice southward. Thus, sea ice extent near the northwestern Antarctic Peninsula continues to decline rapidly, while areas in the Ross Sea and the southern Indian Ocean show significant increases (Stammerjohn et al., 2012). Circumpolar-averaged sea ice extent changes nearly cancel each other out for all months of the year (Parkinson and Cavalieri, 2012). This winter, atmospheric conditions were near average overall, with roughly equal areas of cooler and warmer air temperatures over the sea ice.
Comparing winter and summer sea ice trends for the two poles is problematic since different processes are in effect. During summer, surface melt and ice-albedo feedbacks are in effect; winter processes include snowfall on the sea ice, and wind. Small changes in winter extent may be a more mixed signal than the loss of summer sea ice extent. An expansion of winter Antarctic ice could be due to cooling, winds, or snowfall, whereas Arctic summer sea ice decline is more closely linked to decadal climate warming.
For more information on Antarctic climate and sea ice, see our Sea Ice Index. The NASA Goddard Ozone Watch site also provides additional background information.
Table 1: Previous Arctic sea ice extents for the month of September
Year | Average Artic Sea Ice Extent For September | Trend, in %, per decade (relative to 1979-2000 avg.) | |
| In Millions of Square Kilometers | In Millions of Square Miles | ||
| 2007 | 4.30 | 1.66 | -10.2 |
| 2008 | 4.73 | 1.83 | -11.0 |
| 2009 | 5.36 | 2.08 | -11.1 |
| 2010 | 4.90 | 1.90 | -11.5 |
| 2011 | 4.61 | 1.78 | -12.0 |
| 2012 | 3.61 | 1.39 | -13.0 |
| 1979 to 2000 average | 7.04 | 2.72 | |
| 1979 to 2010 average | 6.52 | 2.52 | |
References
Parkinson, C., and D. Cavalieri. 2012. Antarctic sea ice variability and trends. The Cryosphere 6, 871-880, doi:10.5194/tc-6-871-2012.
Stammerjohn, S., R. Massom, D. Rind, and D. Martinson. 2012. Regions of rapid sea ice change: an inter-hemispheric seasonal comparison. Geophysical Research Letters 39, L06501, doi:10.1029/2012GL050874.
Ding, Q., E. Steig, D. Battisi, and M. Kuttel. 2011. Winter warming in West Antarctica caused by central tropical Pacific warming. Nature Geoscience 4, doi:10.1038/ngeo1129.
Steig, E., D. P. Schneider, S. D. Rutherford, M. Mann, J. C. Comiso, and D. T. Shindell. 2009. Warming of the Antarctic ice-sheet surface since the 1957 International Geophysical Year. Nature 457, 459-462, doi:10.1038/nature07669.
Monaghan, A. J., D. H. Bromwich, W. Chapman, and J. Comiso. 2008. Recent variability and trends of Antarctic near-surface temperature. Journal of Geophysical Research 113, D04105, doi:10.1029/2007JD009094.
Chapman, W. L., and J. E. Walsh. 2007. A synthesis of Antarctic temperatures. Journal of Climate 20 (16), 4096-4117, doi:10.1175/JCLI4236.1.
