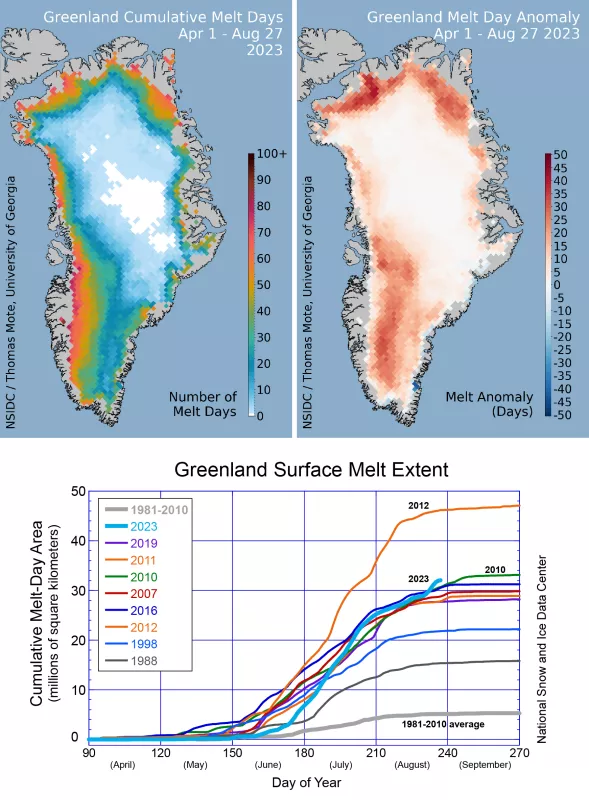
A strong weather pattern from August 21 to 24 caused widespread melting across Greenland. This unusually late summer melt event was caused by a high and low air pressure configuration known as an omega pattern because of its jet stream shape. The 2023 cumulative melt area is currently the second largest in the 45-year satellite record, trailing the extreme melt year of 2012.
Overview of conditions
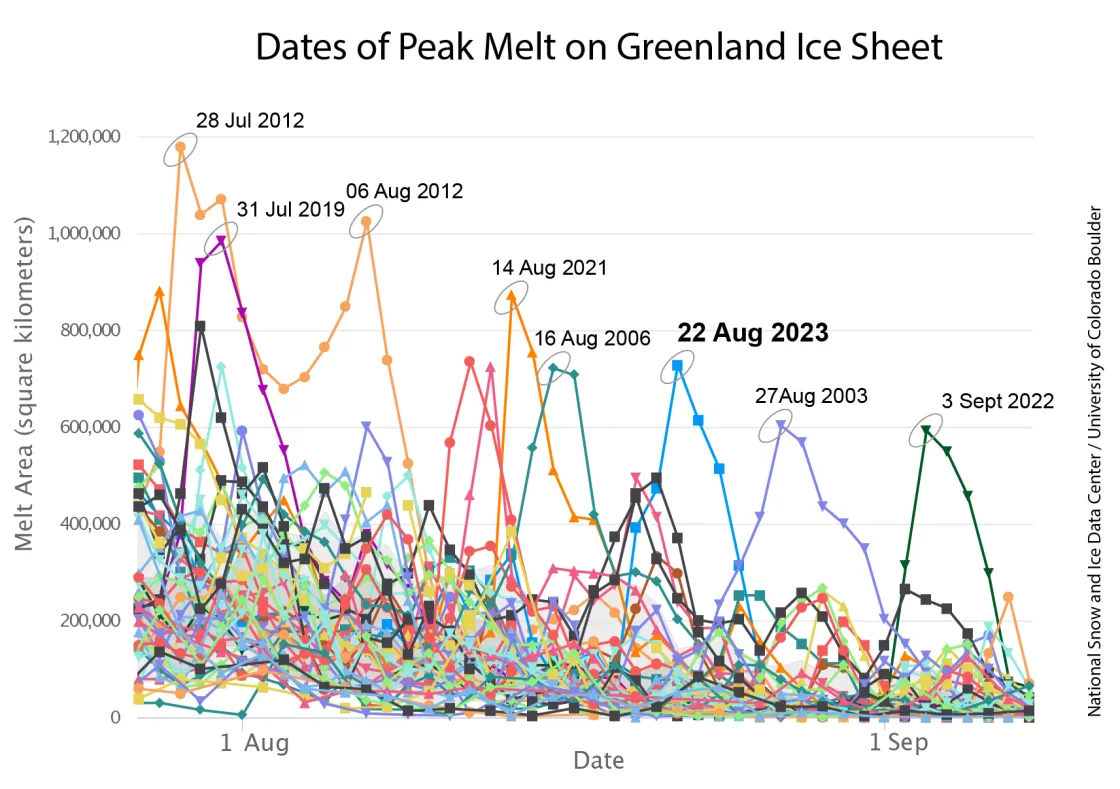
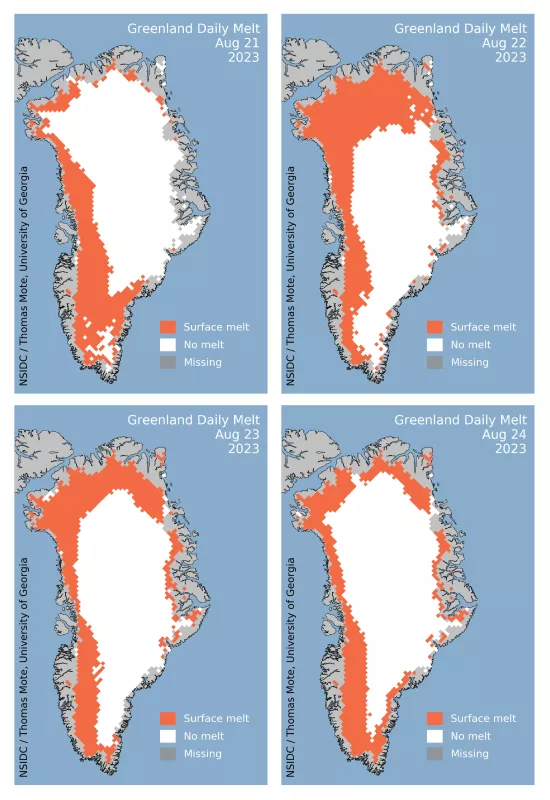
Beginning on August 20, surface melt extent on the ice sheet increased rapidly, following a period when only 10 to 20 percent of the ice sheet melted in the second half of July (Figure 1a). Melt area peaked at nearly 730,000 square kilometers (282,000 square miles) on August 22, covering about 45 percent of the ice sheet (Figure 1b). Melting began in the southwest and spread toward the higher central areas of the ice sheet and northward on August 22, and then eastward on August 23 and beyond (Figure 1c). Cumulative melt-day area is the second highest in the 45-year satellite record with over 30 million square kilometers (11.5 million square miles). This can be compared to the extreme record year of 2012, which accumulated over 45 million square kilometers (17.4 million square miles) by late August. Note that 2010 finished the year with a higher total than the current date for 2023 because of a very late melt event in early September.
Conditions in context
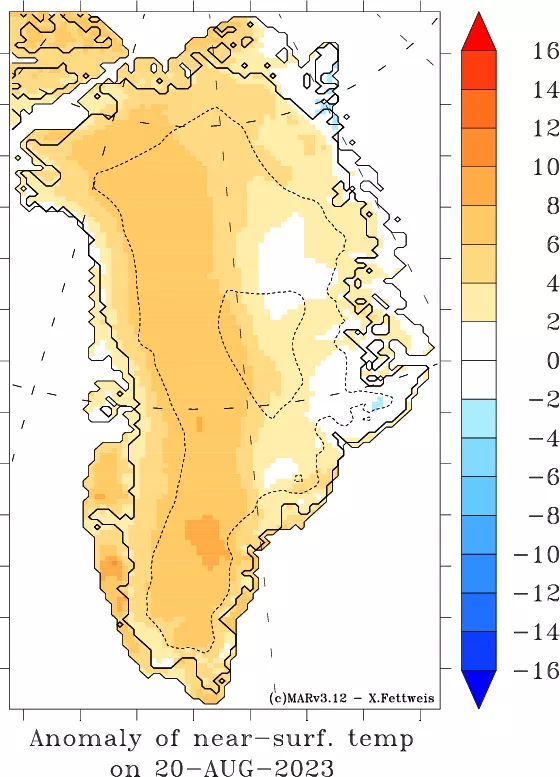
Warm conditions have persisted over all of Greenland through August, and particularly in the northern third of the island, where temperatures averaged 2 to 4 degrees Celsius (4 to 7 degrees Fahrenheit) above the 1991 to 2020 average. High temperatures are often associated with high air pressure over the island, which has been the case with all of Greenland experiencing above average air pressure for the month. Both these trends contrast sharply with conditions on Baffin Island, west of Greenland, where cool conditions and near-average air pressure persisted for most of August.
The omega
The late-season melt event was induced by a recognizable and potentially more frequent weather pattern that brings unseasonably warm conditions. The pattern develops when high pressure that is centered over Greenland is flanked by low air pressure off the western and eastern coasts. The resulting shape of the jet stream resembles the uppercase Greek letter omega (Ω) (Figure 3a). Winds near the surface and in the lower atmosphere flow northward along the western Greenland coast, over the northern flank of the ice sheet, and then downhill and southward on the eastern side. The downhill flow can further warm the air through a chinook or foehn effect, known as dry adiabatic compression. In this case, the pattern was associated with high air temperatures at altitude over the island (700 millibar level, or 10,000 feet above sea level), far above average for this time of year. Surface air temperatures were up to 16 degrees Celsius (29 degrees Fahrenheit) above average, with foehn-effect warming along the eastern Greenland coast during the latter part of the event. Two periods of melting were observed at the Tunu automatic weather station, located in northeastern Greenland on the ice sheet at 2,079 meters above sea level (over 6,821 feet) (Figure 3b). On August 22, the National Oceanic and Atmospheric Administration (NOAA) Observatory at Summit Station had a series 1-minute air temperature readings of about -0.6 degrees Celsius (30.9 degrees Fahrenheit) (Figure 3c). Those data will be further detailed in the seasonal wrap-up report.
Ice art II
On August 22, glaciologist Jason Box took a photo of an ominous sky over Greenland. At this coastal town of Narsaq, conditions were rainy and very warm at 17 degrees Celsius (63 degrees Fahrenheit).
Further reading
Hanna, E., T. E. Cropper, R. J. Hall, R. C. Cornes, and M. Barriendos. 2022. Extended north Atlantic oscillation and Greenland blocking indices 1800–2020 from new meteorological reanalysis. Atmosphere, 13(3), 436, doi:10.3390/atmos13030436.
Mattingly, K.S., J. V. Turton, J. D. Wille, B. Noël, X. Fettweis, Å. K. Rennermalm, and T. L. Mote. 2023. Increasing extreme melt in northeast Greenland linked to foehn winds and atmospheric rivers. Nature Communications, 14(1), 1743, doi:10.1038/s41467-023-37434-8.
Wachowicz, L. J., J. R. Preece, T. L. Mote, B. S. Barrett, and G. R. Henderson. 2021. Historical trends of seasonal Greenland blocking under different blocking metrics. International Journal of Climatology, 41, E3263, doi:10.1002/joc.6923.
Erratum
Readers alerted us to an error within Figure 1b. The last date highlighted on the green line previously stated "12 September 2012." This has been corrected to "3 September 2022" on September 28, 2023.

![This map shows wind speed in nautical miles per hour and height contours as tens of meters of the 500 hPa level in the upper atmosphere (about 5,500 meters or 18,000 feet), in the middle atmosphere, showing the omega pattern [Ω] surrounding Greenland on August 22. This map shows wind speed in nautical miles per hour and height contours as tens of meters of the 500 hPa level in the upper atmosphere (about 5,500 meters or 18,000 feet), in the middle atmosphere, showing the omega pattern [Ω] surrounding Greenland on August 22.](/sites/default/files/styles/article_image/public/images/Other/OmegaPattern.png.webp?itok=PK4p7fZt)

