Our Research
As climate changes, how do Earth's frozen areas affect our planet and impact society?
In this section
Related News & Stories
Filter by:

Analysis - Sea Ice Today
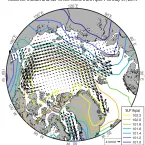
The end of the Arctic sea ice melt season is nigh. The last couple of weeks have seen small rises and falls in ice extent, primarily due to changes in wind patterns.

Spotlight
Sea ice trends are most apparent through data visualization. In 2012, NSIDC software developers launched a data tool called Charctic, which allows users to interact with sea ice data and clearly see sea ice decline. This is the story of how Charctic came to be and how it continues to influence science and the public.

Analysis - Sea Ice Today
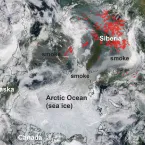
While Arctic sea ice extent was tracking at record low levels in July and August, the pace of ice loss slowed considerably after the middle of August, despite above-average air temperatures over much of the Arctic Ocean.

Feature Story
From 1980 to 2010, a young researcher used the sea ice concentration data from the National Snow and Ice Data Center (NSIDC) to forecast the arrival of Alaska's Chinook Salmon in the Yukon River.
Analysis - Sea Ice Today
Arctic sea ice extent in July tracked at record low levels for multiple individual days and for the month as a whole.
