Our Research
As climate changes, how do Earth's frozen areas affect our planet and impact society?
In this section
Related News & Stories
Filter by:
Analysis - Sea Ice Today
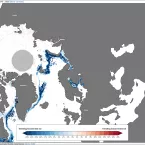
Sea ice extent for February 2020 tracked below average, ranking as the thirteenth lowest monthly average in the satellite record. A brief pause in ice growth in the middle of February was related to the regional wind pattern.

Feature Story
A new visualization tool, the Sea Ice Analysis Tool, has just been added to the NSIDC Arctic Sea Ice News & Analysis (ASINA) website that helps users customize the satellite data further, creating graphs or maps that show changes based on their chosen criteria.

Analysis - Snow Today
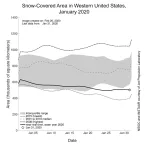
Introducing Snow Today, a scientific analysis website that provides a snapshot and interpretation of snow conditions in near-real time across the Western United States, told with a unique combination of satellite data and surface observations.

Analysis - Sea Ice Today
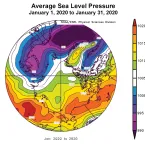
Sea ice extent for January 2020 tracked well below average, with the monthly average tied at eighth lowest in the satellite record.

Feature Story
Seven engineering students from the University of Colorado (CU) Boulder spent a year working as part of the Thwaites-Amundsen Regional Survey and Network (TARSAN) project team for the International Thwaites Glacier Collaboration (ITGC).

Feature Story
With the support of National Snow and Ice Data Center (NSIDC) sea ice concentration data, a team of researchers tries to catch another glimpse of an under-ice phytoplankton bloom that fuels the Arctic food web. The team aims to understand the survival mechanisms at play in this dark, harsh place.