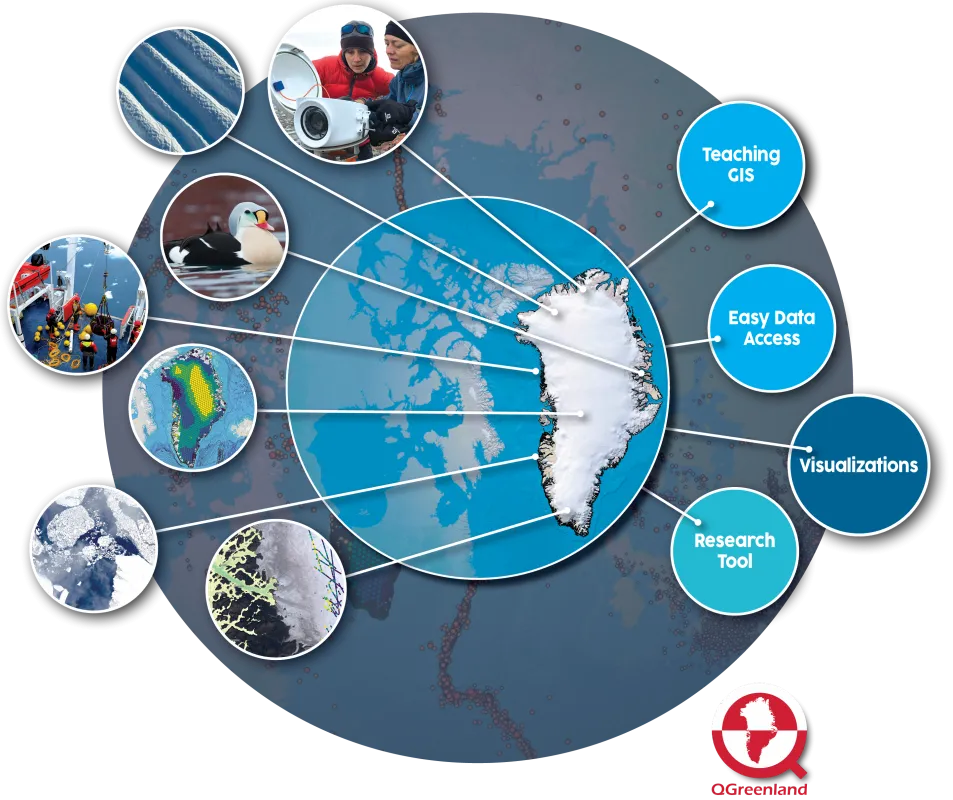
Across the Arctic, sea ice is disappearing, permafrost is thawing, and glaciers are melting, causing local and global changes to our planet. One important feature of the Arctic is Greenland. Much of Greenland, the largest island in the world, is covered by the Greenland Ice Sheet. The Greenland Ice Sheet is the second-largest ice sheet on Earth. Observations of the region show that the Greenland Ice Sheet has been rapidly losing ice since the late 1990s, making it a top contributor to sea level rise in recent decades. As the planet continues to warm, scientists predict that levels of melting will accelerate. These changes will dramatically transform Greenland’s landscape, impacting its ecosystems and communities, as well as increasing sea levels globally.
The better we understand the connections among environmental, biological, and human changes in Greenland, the more successfully we can mitigate the negative effects of rapid environmental change. QGreenland is a free and open-source mapping tool that can be used to better understand and research the changes occurring in Greenland and the connections among them.
Exploring Greenland, digitally
QGreenland, which was created by an international team of researchers led by NSIDC’s Twila Moon, allows for the exploration of data on Greenland’s ocean, land, ice sheet, biology, and communities. Data within the tool are available from a range of disciplines, including glaciology, biology, environmental management, hydrology, and much more. QGreenland can be used for a wide variety of purposes. For example, users can study changes in ice sheet velocity, identify community roads and buildings, and discover what types of permafrost are located in Greenland and where.
Users can access, download, add to, and conduct analyses on data within the QGreenland environment, which runs on freely available QGIS software. It can be used both on- and offline, which means that it is available to researchers and Greenland residents even when they are out in remote field sites without internet access, and they can save their work within it as well. Users can also create presentation- and publication-ready visualizations and maps using QGreenland’s wide variety of spatial data.
QGreenland is modeled after the Norwegian Polar Institute’s Quantarctica tool, which provides an interactive data environment for Antarctica.
Inspiring and expanding Greenland research
QGreenland is a unique geographic information system (GIS) tool focused on Greenland that enables a diverse range of users to explore how Greenland’s landscape is changing. There are so many reasons that it is crucial that we study Greenland and the changes occurring there. Did you know, for example, that if the Greenland Ice Sheet melted completely, sea levels could rise by 7.4 meters, or 24 feet? Forty-four percent of the world’s population lives within 150 kilometers (93 miles) of the sea, and eight out of the 10 largest cities in the world are located near the ocean. This means that Tokyo, Mumbai, New York City, Shanghai, Lagos, Los Angeles, Calcutta, and Buenos Aires could all be underwater in the centuries to come. How quickly and to what extent the Greenland Ice Sheet melts will determine the fates of these cities and their people. In addition, the melting of the ice sheet impacts Greenland locally and regionally, via exposure of new ocean area and coastal lands, changing nutrient and sediment transfer from land to ocean, and shifting resources for hunting and fishing. The better we understand the effects of global warming on Greenland, the more information and time we will have to adapt to the changes occurring now and in the future. QGreenland can help us to explore, analyze, and share data and findings.
The QGreenland project team developed the tool to bring in new data users, inspire more and quicker data analysis, and drive new Greenland research. The QGreenland package and accompanying resources can also be useful to a variety of audiences beyond scientists, such as community resource managers, educators, and policymakers. A community resource manager, for example, could use the tool to find out what geographical features exist near his or her community, how these features are changing, and how this could affect resources within that community. A professor, on the other hand, could use the tool to help teach their students how to use GIS software. The project team has developed a wide range of materials to help with using QGreenland in the classroom or for research projects, including tutorial videos, curriculum, and complete documentation.
Contributions from an international team
The QGreenland project is led by NSIDC with collaboration from multiple organizations around the world. These collaborating organizations include the Greenland Institute of Natural Resources, University of Greenland, Asiaq, Danish Meteorological Institute, Danish Technical University, and Geological Survey of Denmark and Greenland, as well as University of Southern Maine. QGreenland began in 2019 and was initially funded by the National Science Foundation’s EarthCube project, which focuses on fostering a better understanding of our complex and changing planet. Currently, QGreenland development includes a partnership with the Arctic Data Center and if funded by the National Science Foundation Geoscience O(Pen Science Ecosystem program. Learn more by visiting the QGreenland website.

