By Agnieszka Gautier
Scientists expect Arctic summer sea ice to eventually disappear. Conservative estimates put the timeline by the end of the century, while more aggressive estimates suggest the Arctic Ocean may be free of summer sea ice within two or three decades. Such a change requires people living and working in the Arctic to prepare. With less sea ice, will oil and gas exploration and extraction increase? Will Arctic tourism rise, and if so, how will it effect surrounding environments, wildlife, and inhabitants? Will some communities face relocation? And how can field researchers continue to safely study the ice?
Those questions cannot be answered without knowing where and when ice may occur. But predictions are a bit tricky, especially for atypical years. NSIDC research scientist Julienne Stroeve wanted to know the quality of current predictions; so she compared forecasts to actual observations. “Just how well are we doing?” Stroeve asked.
The life cycle of sea ice
Yearly, sea ice ebbs and flows, reaching its maximum in March and minimum in September. Sea ice extent since the early 1970s, when satellite monitoring began, is in a downward trend. Its minimum extent declines at an average linear rate of 13.4% per decade. In September 2012, sea ice extent set a new record—dropping an area about the size of Texas from the pervious record set in 2007. The new record extent lost 2.83 million square kilometers (1.09 million square miles) below the 1981 to 2010 average minimum, representing an area nearly four times the size of Texas.
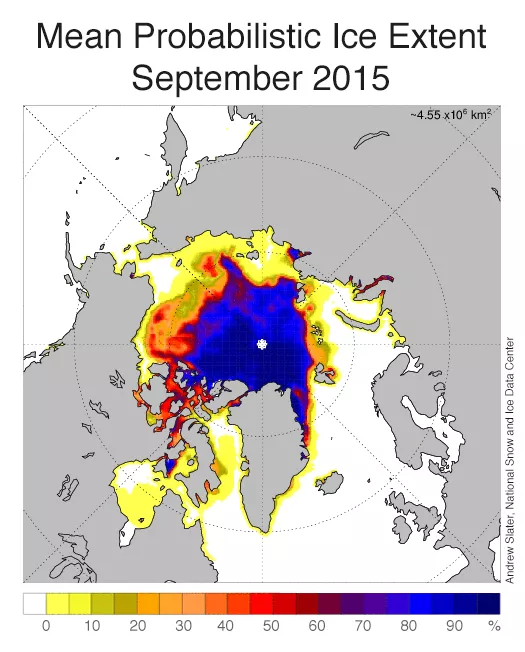
Another way to consider the decline: the nine lowest September ice extents over the satellite record have all occurred in the last nine years. Though not every year is a record-breaking low, the trend is undeniable. For those keeping an eye on sea ice, predicting the quality of ice (thickness) and its location (where and when) is tantamount to the success of Arctic operations. Predictions have moved forward a bit. “Beforehand, it was just sea ice extent,” Stroeve said, “but now we’re also getting spatial maps of ice probability.” Total extent is just a number, the total area, but it is not practical for people working in the Arctic. The spatial maps offer the location of ice. Though this adds valuable information for seasonal predictions of sea ice, how accurate is the information?
On modeling
In 2008, the Study of Environmental Change (SEARCH) program solicited input from the research community, which used a wide variety of methods to garner estimates on predicting sea ice extent every year. In 2013, a newly funded interagency project, the Sea Ice Prediction Network (SIPN), took over SEARCH’s synthesis effort. “This brings together a bunch of researchers from different institutes to create a network of scientists and stakeholders trying to advance sea ice forecasting on the seasonal timescale,” Stroeve said.
Current forecasts do not do so well. Andrew Slater, a NSIDC research scientist, developed a statistical forecast to calculate the probability of ice for a given location (i.e., at each grid cell). “Right now his forecasts as a whole do better than the dynamical forecasts,” Stroeve said. A dynamical model simulates the interaction of important components to climate, such as ocean, atmosphere, land surface, and ice. It estimates the energy balance, where solar energy enters, and heat disperses into various outlets like the oceans and atmosphere. Slater’s statistical forecast, on the other hand, is not interested in all the details of the sea ice environment. Instead, he takes a low sea ice situation and continues the anomaly linearly. Models can run a forecast at any point, but seasonal forecasts improve the closer they get to the date of prediction. Slater’s model fares best for a 50-day lead, but is not good the further out it begins. Slater’s model predicted record-breaking lows for 2005, 2007, and 2012.
The future of predictability
Communities that need to resupply in the fall need to know the time and place of freeze-ups. “We need to communicate to different stakeholders what the prediction skill is and how much to trust results,” Stroeve said. A false green light may trap icebreakers, halting supplies.
Stroeve hopes to put some of these models head-to-head. These intercomparison projects measure the sensitivity of models. So if everyone uses the same input data, it helps scientists see which models perform better. It is a way to tweak the machine to get the ultimate model. “So should we put more effort to make sure we have all the observations we need to drive the models or do we need to put more effort in improving the models themselves? What would bring the most improvement?” Stroeve asked.
Stroeve, however, is not that optimistic about the future of forecasting. A key component of sea ice predictions requires a better sense of summer weather patterns. “Weather forecasts are not good for more than week or two out. We’re just not there. It’s too complex. It’s too chaotic,” Stroeve said. Without knowing what the weather will do, predictability will continue to be limited. Sea ice extent is shrinking, but also there is less multi-year ice, ice that has been around for two or more years. As the ice thins, climate models exhibit more year-to-year variability. “So our skill may actually decrease in the future,” Stroeve said. “That’s one of the things we need to better understand thinning ice. For now, we don’t know.” However, fostering dialogue between scientists, their models, community observers, and stakeholders requires a forum. SIPN now hosts bimonthly webinars. The informal exchange of information may better forecasting as new frontiers open in the Arctic.
Reference
Stroeve, J. C., L. Hamilton, C. Bitz, and E. Blanchard-Wigglesworth. 2014. Predicting September sea ice: Ensemble skill of the SEARCH sea ice outlook 2008–2013. Geophys. Res. Lett., 41(7), 2411–2418, doi:10.1002/2014GL059388.
Stroeve, J., E. Blanchard-Wrigglesworth, V. Guemas, S. Howell, F. Massonnet, and S. Tietsche. 2015. Improving predictions of Arctic sea ice extent. Eos, 96, doi:10.1029/2015EO031431.


