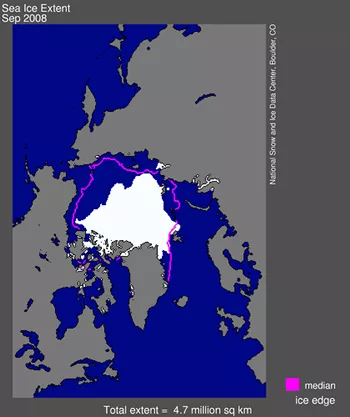
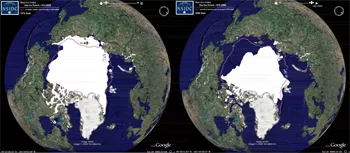
Arctic sea ice extent during the 2008 melt season dropped to the second-lowest level since satellite measurements began in 1979, reaching the lowest point in its annual cycle of melt and growth on September 14, 2008. Average sea ice extent over the month of September, a standard measure in the scientific study of Arctic sea ice, was 4.67 million square kilometers (1.80 million square miles) (Figure 1). The record monthly low, set in 2007, was 4.28 million square kilometers (1.65 million square miles); the now-third-lowest monthly value, set in 2005, was 5.57 million square kilometers (2.15 million square miles).
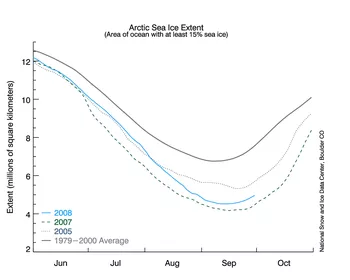
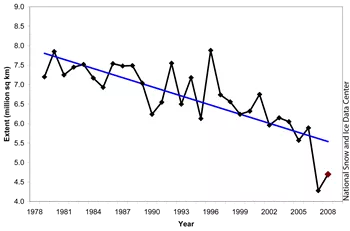
The 2008 season strongly reinforces the thirty-year downward trend in Arctic ice extent. The 2008 September low was 34% below the long-term average from 1979 to 2000 and only 9% greater than the 2007 record (Figure 2). Because the 2008 low was so far below the September average, the negative trend in September extent has been pulled downward, from –10.7 % per decade to –11.7 % per decade (Figure 3).
NSIDC Senior Scientist Mark Serreze said, “When you look at the sharp decline that we’ve seen over the past thirty years, a ‘recovery’ from lowest to second lowest is no recovery at all. Both within and beyond the Arctic, the implications of the decline are enormous.”
Conditions in spring, at the end of the growth season, played an important role in the outcome of this year’s melt. In March 2008, thin first-year ice covered a record high 73% of the Arctic Basin. While this might seem like a recovery of the ice, the large extent masked an important aspect of sea ice health; thin ice is more prone to melting out during summer. So, the widespread thin ice of spring 2008 set the stage for extensive ice loss over the melt season.
Through the 2008 melt season, a race developed between melting of the thin ice and gradually waning sunlight. Summer ice losses allowed a great deal of solar energy to enter the ocean and heat up the water, melting even more ice from the bottom and sides. Warm oceans store heat longer than the atmosphere does, contributing to melt long after sunlight has begun to wane. In August 2008, the Arctic Ocean lost more ice than any previous August in the satellite record.
NSIDC Research Scientist Walt Meier said, “Warm ocean waters helped contribute to ice losses this year, pushing the already thin ice pack over the edge. In fact, preliminary data indicates that 2008 probably represents the lowest volume of Arctic sea ice on record, partly because less multiyear ice is surviving now, and the remaining ice is so thin.” (See Figure 4.)
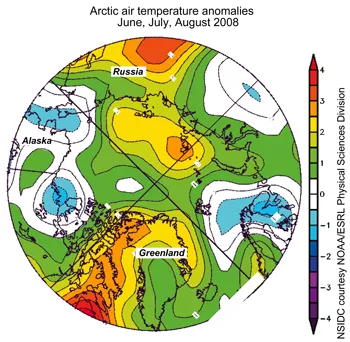
In the end, however, summer conditions worked together to save some first-year ice from melting and to cushion the thin pack from the effects of sunlight and warm ocean waters. This summer’s weather did not provide the “perfect storm” for ice loss seen in 2007: temperatures were lower than 2007, although still higher than average (Figure 5); cloudier skies protected the ice from some melt; a different wind pattern spread the ice pack out, leading to higher extent numbers. Simply put, the natural variability of short-term weather patterns provided enough of a brake to prevent a new record-low ice extent from occurring.
NSIDC Research Scientist Julienne Stroeve said, “I find it incredible that we came so close to beating the 2007 record—without the especially warm and clear conditions we saw last summer. I hate to think what 2008 might have looked like if weather patterns had set up in a more extreme way. ”
The melt season of 2008 reinforces the decline of Arctic sea ice documented over the past thirty years (Figure 6 and Figure 7). NSIDC Lead Scientist Ted Scambos said, “The trend of decline in the Arctic continues, despite this year's slightly greater extent of sea ice. The Arctic is more vulnerable than ever.”
References
Maslanik, J.A., C. Fowler, J. Stroeve, S. Drobot, J. Zwally, D. Yi, and W. Emery. 2007. A younger, thinner Arctic ice cover: Increased potential for rapid, extensive sea-ice loss, Geophysical Research Letters, vol. 34, L24501, doi:10.1029/2007GL032043.
Stroeve J., M.M. Holland, W. Meier, T. Scambos, and M. Serreze, 2007. Arctic sea ice decline: Faster than forecast, Geophys. Res. Lett., vol. 34, L09501, doi:10.1029/2007GL029703.
Stroeve J., M. Serreze, S. Drobot, S. Gearheard, M. Holland, J. Maslanik, W. Meier, and T. Scambos. 2008. Arctic sea ice extent plummets in 2007, EOS Transactions of the American Geophysical Union, vol. 89, pp. 13–14.
