By Michon Scott
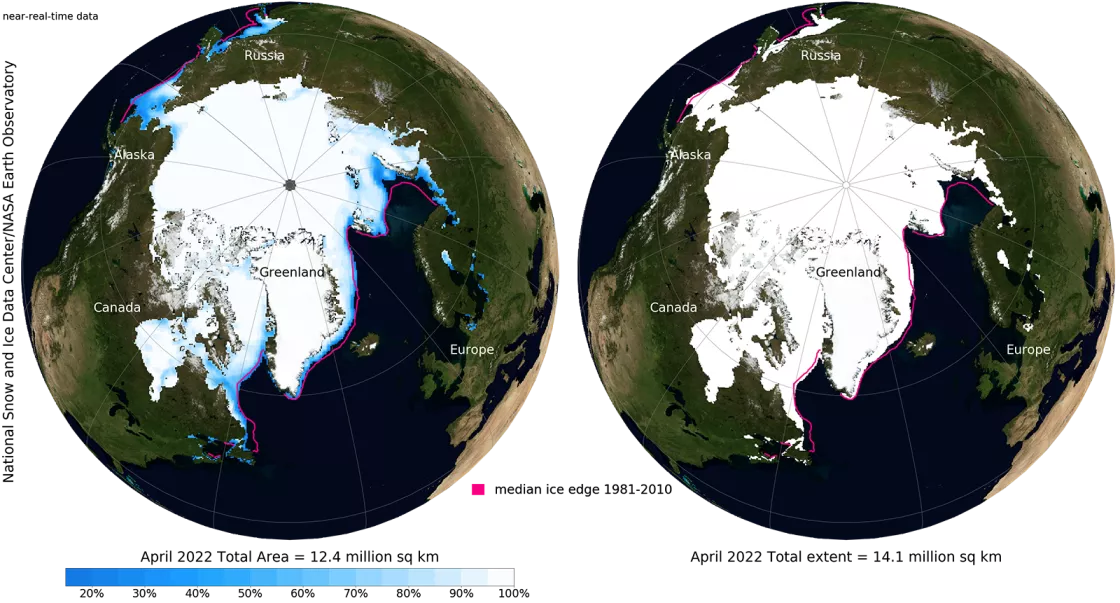
Scientists may report different numbers for how much Arctic or Antarctic sea ice exists at a particular time. Different satellite sensors “see” sea ice differently, but another factor is whether scientists measure sea ice area or sea ice extent.
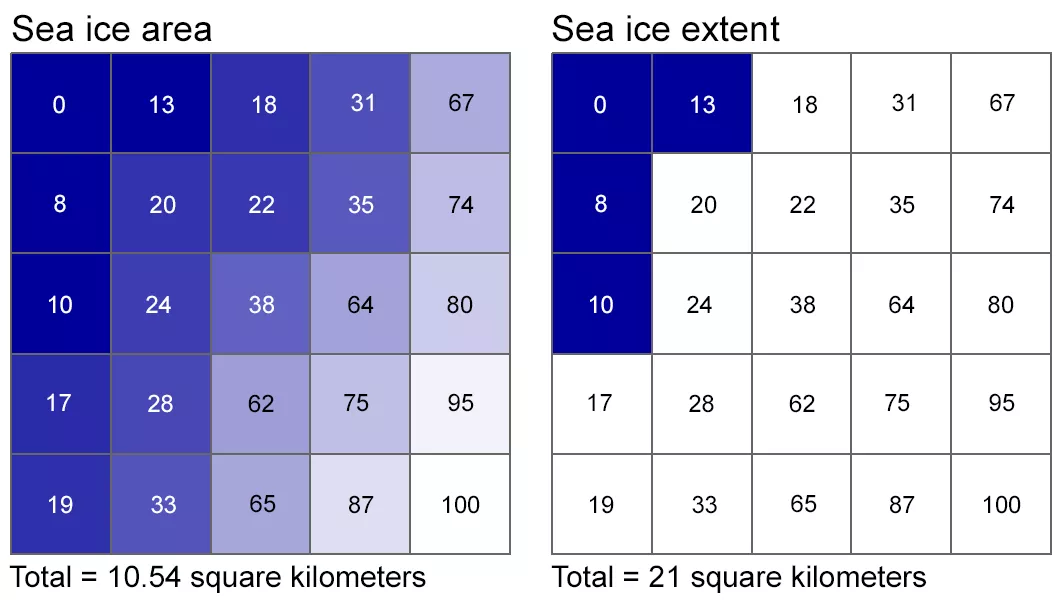
Although area and extent may sound synonymous, they are different measurements, rendering different numbers, even from the same satellite observations. Sea ice area is the total region covered by ice. Extent is the total region with at least 15 percent sea ice cover. NSIDC usually reports extent, which gives higher values than area.
Understanding the difference in detail begins with understanding the building blocks of digital images.
Image building blocks
Let us start with a photo of something far away from the polar regions: flowers blooming in spring.
Zooming in on a portion of the photo, to the greatest magnitude possible, shows the building blocks of the photo.
This digital photo is composed of pixels: teeny square tiles, arranged in a grid. A photo may incorporate thousands, even millions of colors but, as the smallest possible element of the image, each pixel can only show a single color.
NSIDC’s satellite-derived sea ice products work in roughly the same way as this digital image. NSIDC projects satellite observations of sea ice onto grids, and each grid cell has a single value.
Seeing with passive microwave sensors
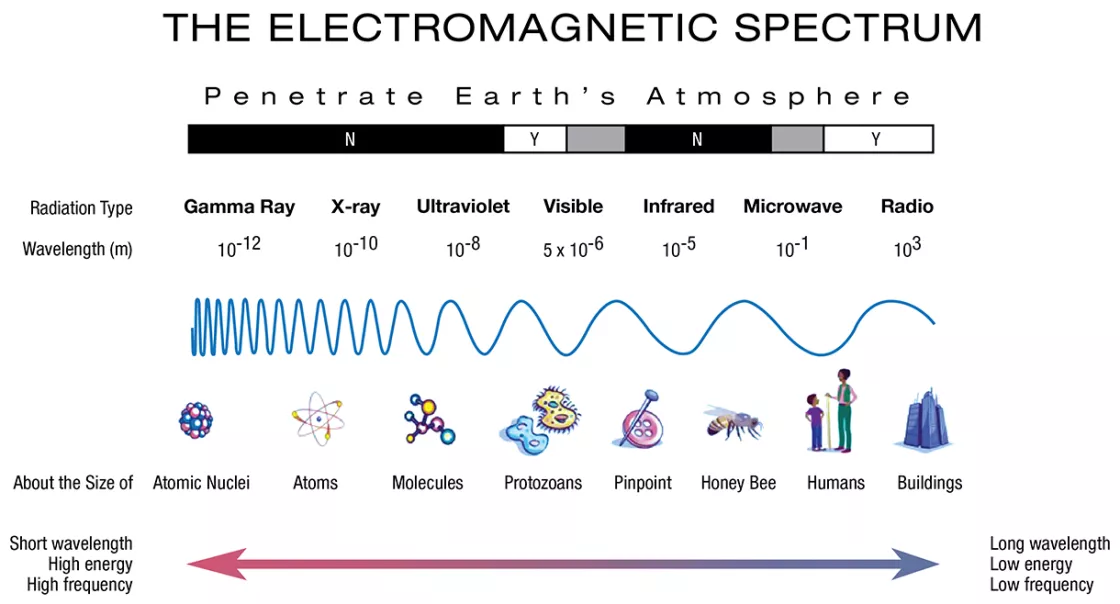
To monitor sea ice and produce grids, NSIDC typically relies on passive microwave sensors. Instead of bouncing a beam of energy off Earth’s surface, they passively observe the natural energy coming from the planet, and they observe energy from the microwave portion of the electromagnetic spectrum.
Passive microwave sensors can “see” the ice through clouds and in the dark. So they can track sea ice changes during months of polar darkness. Their all-seeing ability comes with some costs, though. They have coarse spatial resolution; a single grid cell may cover tens of kilometers. They also tend to underestimate the amount of sea ice in the presence of melt ponds or cracks in the ice. Still, these sensors provide ample detail for tracking sea ice changes over time.
Achieving simplicity with a threshold
NSIDC sea ice data products are often based on ice concentration: how much sea ice exists in the area covered by each grid cell. Concentration is generally expressed as a percentage. Both area and extent calculations require a concentration threshold of 15 percent, and grid cells with concentrations below that threshold are dropped from the total. Scientists use that threshold because it provides consistent agreement between satellite and surface observations.
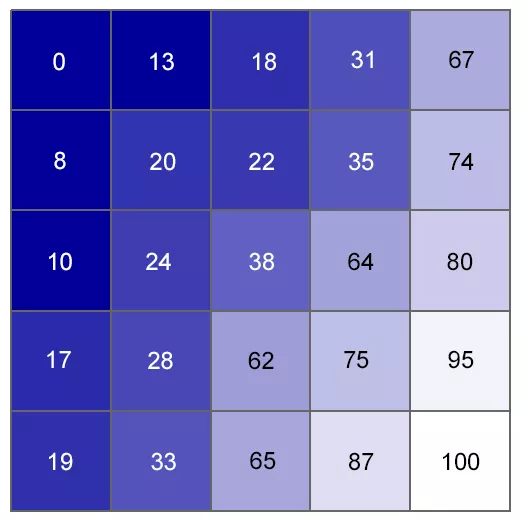
To illustrate how the process works, imagine a tiny portion of a sea ice grid, containing just 25 cells. The amount of sea ice per grid cell ranges from 0 percent (upper left corner) to 100 percent (lower right corner). In actual passive microwave imagery, each grid cell would cover a larger area, but to keep the math simple, assume each grid cell covers just a single square kilometer.
Calculating sea ice area means multiplying the area covered by each grid cell by the percentage of sea ice it contains, provided it has at least 15 percent concentration: 0.18 * 1 square kilometer + 0.31 * 1 square kilometer + 0.67 * 1 square kilometer + 0.20 * 1 square kilometer . . . and so on.
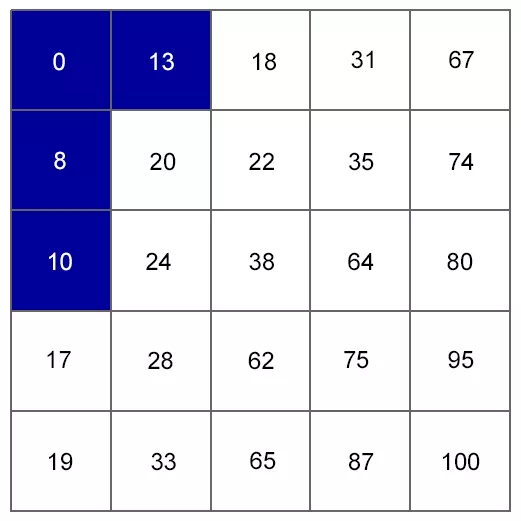
Area can be a useful measurement of precisely how much sea ice fills a particular portion of the ocean. But NSIDC scientists, like most researchers, instead calculate and report extent. Grid cells at or above the 15 percent threshold are added to the total in their entirety.
Calculating sea ice extent means simply adding up all the grid cells with 15 percent or more. So 21 of these 25 grid cells make the cut. That is how sea ice extent renders a higher value than area.
Handling the hole at the North Pole
Since 1978, scientists have been able to continuously monitor polar sea ice using polar-orbiting satellites. While the satellites have passed over the polar regions, they have not passed directly over the poles. This has resulted in a gap in Arctic sea ice observations, nicknamed “the pole hole.” Technology improvements have shrunk the gap but not eliminated it, and its existence in historical records requires sea ice scientists to make assumptions about sea ice at the North Pole.
NSIDC has always treated the gap at the pole as if it contained at least 15 percent concentration. The unseen region at Earth’s northernmost region is therefore added to the Northern Hemisphere sea ice extent total. (There is a gap at the South Pole, too, but it is in the middle of Antarctica, where the ice is land based.)
Why use extent instead of area?
One answer relates to confidence in the estimates. Although passive microwave sensors see well during the dark polar winters, they face challenges, especially during the melt season. The sensors do not always distinguish well between ocean water and surface meltwater, potentially underestimating concentration. Extent measurements can compensate by simply including every grid cell with 15 percent or more sea ice concentration in the extent total. Getting the extent figure right does not require precisely measuring the sea ice concentration of every grid cell. Instead, it just means identifying the grid cells that meet the threshold.
Another answer relates to the pole hole. Early in the satellite record, the hole was larger than it is now. If that region had been considered ice-free, technology improvements that shrank the hole would have artificially boosted sea ice numbers over time. By adopting the largest hole across the satellite record, and assuming it contained at least 15 percent sea ice concentration, scientists have prevented the pole hole’s changing size from distorting sea ice trends.
Relying on extent rather than area has other advantages. There is greater agreement among sea ice experts across institutions about sea ice extent than there is about sea ice area. In addition, simply counting the grid cells that meet the threshold, which includes most grid cells within the sea ice perimeter, reduces day-to-day variability in sea ice numbers.
References
Matthews, J. L., G. Peng, W.N. Meier, and O. Brown. 2020. Sensitivity of Arctic Sea Ice Extent to Sea Ice Concentration Threshold Choice and Its Implication to Ice Coverage Decadal Trends and Statistical Projections. Remote Sensing, 12(5): 807. https://doi.org/10.3390/rs12050807.


