On August 14, 2021, rain was observed at the highest point on the Greenland Ice Sheet for several hours, and air temperatures remained above freezing for about nine hours. This was the third time in less than a decade, and the latest date in the year on record, that the National Science Foundation's Summit Station had above-freezing temperatures and wet snow. There is no previous report of rainfall at this location (72.58°N 38.46°W), which reaches 3,216 meters (10,551 feet) in elevation. Earlier melt events in the instrumental record occurred in 1995, 2012, and 2019; prior to those events, melting is inferred from ice cores to have been absent since an event in the late 1800s. The cause of the melting event that took place from August 14 to 16, 2021, was similar to the events that occurred this late July, where a strong low pressure center over Baffin Island and high air pressure southeast of Greenland conspired to push warm air and moisture rapidly from the south.
Overview of conditions
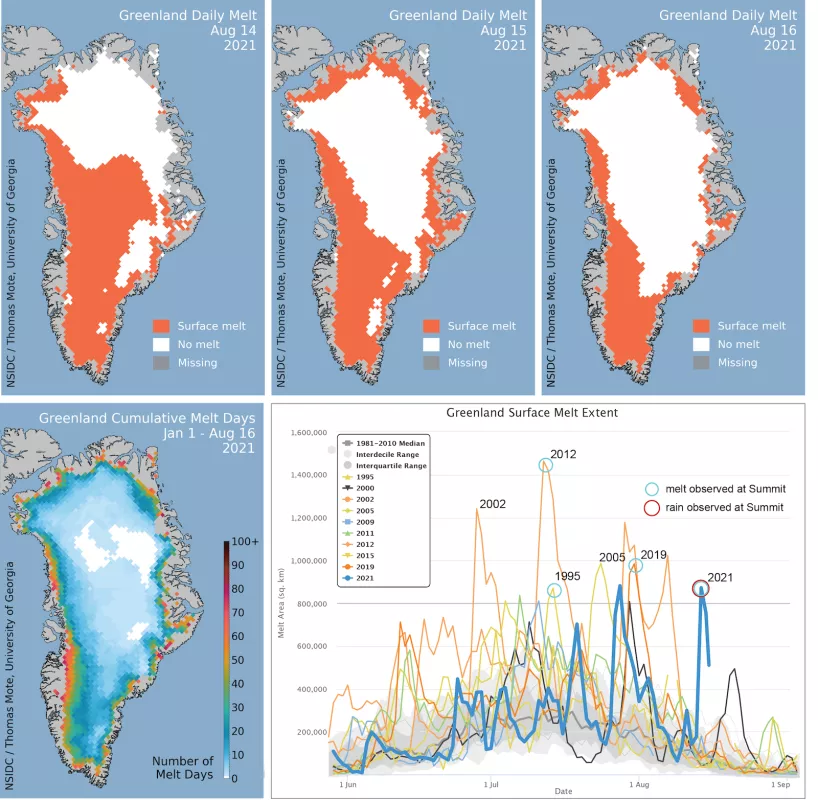
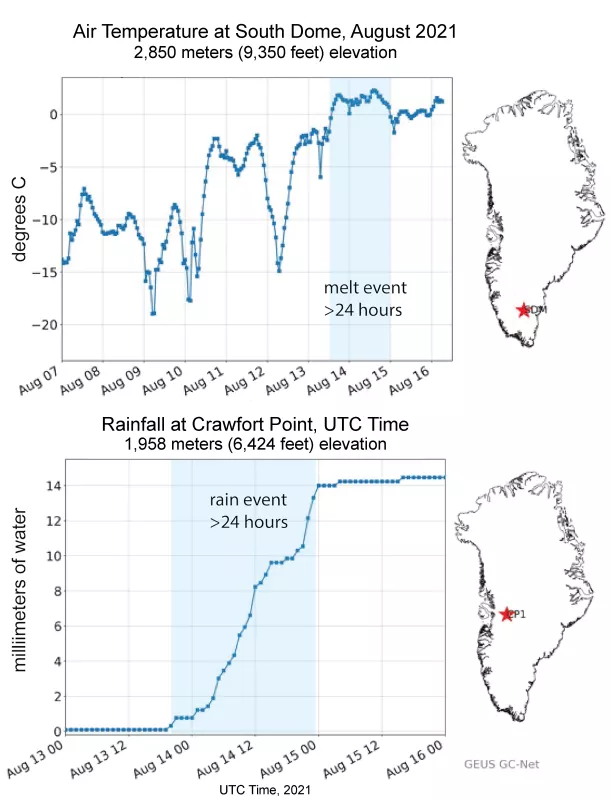
Widespread surface melting and an extensive rainfall event along the southeast coast extending up to the Summit region of Greenland occurred on August 14 and 15, with melt area returning to moderate levels on August 16 (Figure 1a). Melt extent peaked at 872,000 square kilometers (337,000 square miles)on August 14, dropping to 754,000 square kilometers on the 15 and 512,000 square kilometers (198,000 square miles) on August 16. Only 2012 and 2021 have had more than one melt event of 800,000 square kilometers (309,000 square miles) in extent, and the August 14 event was the latest date for this scale of melt extent in the satellite record. Temperatures surpassed the freezing point at Summit Station around 0700 UTC (5:00 am local time) on August 14, and the rain event began at the same time (Figure 1b). For the next several hours, rain fell and water droplets were seen on surfaces near the camp as reported by on-station observers. At about 1400 UTC the snow surface began to form thin sheets of ice crystals as the rain froze into the snow. Winds were 9.8 meters per second (22 miles per hour) from the southwest with a mix of freezing and non-freezing rain. Temperatures peaked at 0.48 degrees Celsius (33 degrees Fahrenheit) around 10:40 UTC and dropped below freezing around 16:20 UTC. Temperatures fell steadily through the evening. As skies cleared late in the evening, a sharp cooling brought temperatures to -8.5 degrees Celsius (16.7 degrees Fahrenheit) early on August 15 (Figure 2). Temperatures at Summit did not reach the melting point on August 15 or 16. The total aerial extent of surface melting (total melt-day extent) for 2021 through August 16 is 21.3 million square kilometers (8.2 million square miles), tied for the fourteenth highest total to date, and well above the 1981 to 2010 average of 18.6 million square kilometers (7.2 million square miles).
Conditions in context
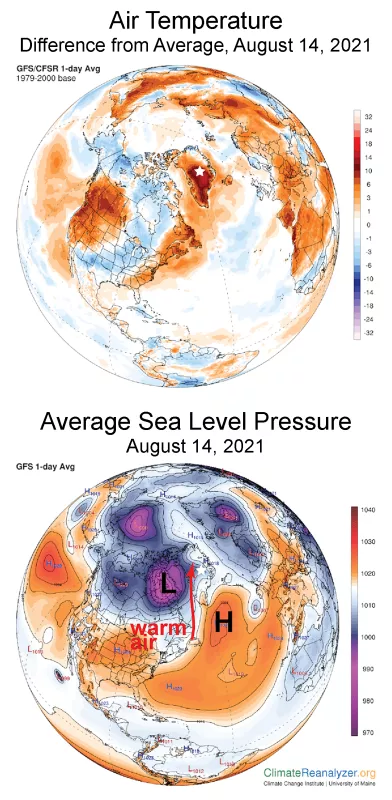
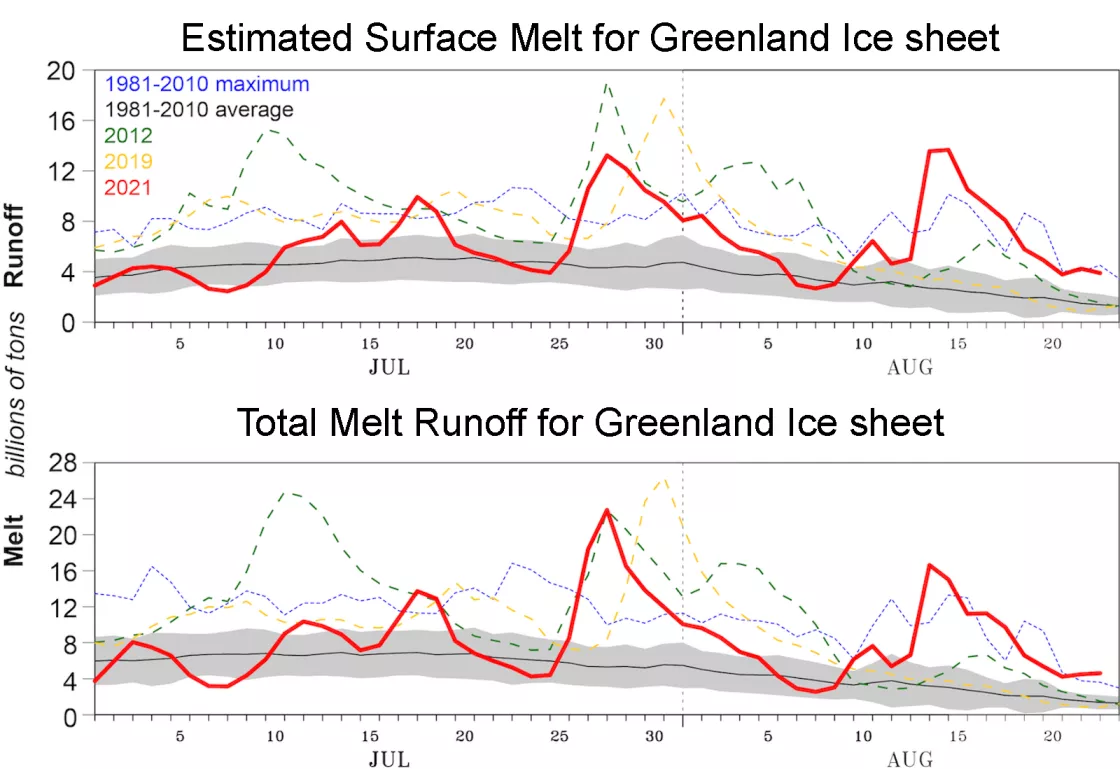
An air circulation pattern very similar to the extensive melt events of late July (see previous post) caused the extensive melt and rain event of mid-August 2021. A moderately strong low pressure center (center pressure 987 millibars) moved northeastward across Hudson Bay towards Baffin Island (Figure 2a). At the same time, high air pressure off the southern end of Greenland in the Denmark Strait created a strong pressure gradient in the southern Labrador Sea and Baffin Bay, forcing a strong wind event from the south-southwest to the northeast and onto the southwestern Greenland coast. This warm moist air then covered the island over the next few days. As clearing skies emerged on August 15, much of the north-central ice sheet cooled significantly. Warm conditions and the late-season timing of the three-day melt event coupled with the rainfall led to both high melting and high runoff volumes to the ocean. Data from MARv3.12 suggests this was the largest rainfall event since 1950, the beginning of ERA-5 (Figure 2b). Melt volume does not, however, include the additional water from rainfall during the warm air intrusion, although rainfall in runoff areas (where the surface is icy and impermeable) is included. Over most of the ice sheet, meltwater (or rainfall in the upper reaches of the ice sheet) percolates into remaining snow and refreezes; however, in bare ice and water-saturated snow areas near the coast, meltwater (and rainfall) runoff occurs resulting in the ice sheet losing mass. On August 15 2021, the surface mass lost was seven times above the mid-August average according to MARv3.12. At this point in the season, large areas of bare ice exist along much of the southwestern and northern coastal areas, with no ability to absorb the melt or rainfall. Therefore, the accumulated water on the surface flows downhill and eventually into the ocean.
Rain check
Above freezing temperatures and rainfall were widespread to the south and west of Greenland during the three-day period, with exceptional readings from several remote weather stations in the area. Total rainfall on the ice sheet was 7 billion tons. At South Dome, the highest point on the southern lobe of the ice sheet at 2,850 meters (9,350 feet) elevation melt was recorded by satellite during all three days of the warm event, and the early part of this period (Figure 3) shows the rapid warming and persistent above-freezing conditions for August 14 and 15.
References
Fettweis, X., M. Tedesco, M. Broeke, J. and Ettema. 2011. Melting trends over the Greenland ice sheet (1958–2009) from spaceborne microwave data and regional climate models. The Cryosphere, 5(2), 359-375, doi:10.5194/tc-5-359-2011.
Nghiem, S. V., D. K. Hall, T. L. Mote, M. Tedesco, M. R. Albert, K. Keegan, C. A. Shuman, N. E. DiGirolamo, and G. Neumann. 2012. The extreme melt across the Greenland ice sheet in 2012. Geophysical Research Letters, 39(20), doi:10.1029/2012GL053611.
The Geological Survey of Denmark and Greenland (GEUS) is carrying forward the Greenland Climate Network (GC-Net) initiated by Konrad Steffen of the Cooperative Institute for Research in Environmental Sciences (CIRES) at the University of Colorado Boulder in 1995.
Summit Station is owned and operated by the National Science Foundation Office of Polar Programs with permission from the Government of Greenland.
Acknowledgements
A special acknowledgement goes out to Alicia Bradley and Zoe Courville for reporting observations at Summit Station, Greenland. Greenland Ice Sheet Today is produced at the National Snow and Ice Data Center by Ted Scambos, Julienne Stroeve, and Lora Koenig with support from NASA. NSIDC thanks Jason Box and Robert Fausto of the Geological Survey of Denmark and Greenland (GEUS), Xavier Fettweis, Christopher Shuman, and Thomas Mote for data and collaboration.


