Extensive and persistent melt in northern Greenland characterized late July to early August. A brief high pressure pattern centered on the west coast led to similar conditions that made 2015 a record melt year for the ice sheet's northern sections. Overall, however, reduced melting and heavy early springtime snowfall may result in a net increase in Greenland's ice mass this year for the first time this century.
Overview of conditions
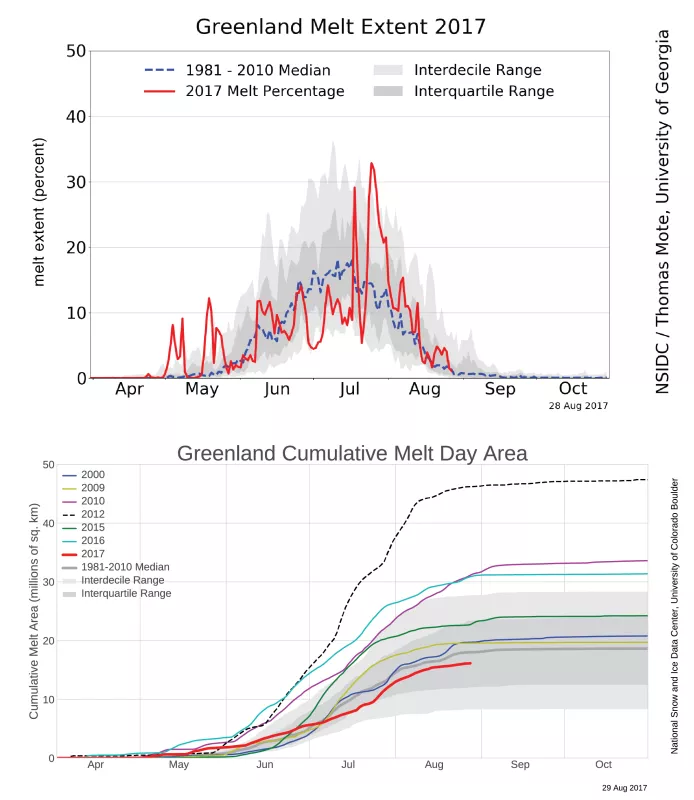
The 2017 melt season has been less intense than recent years, and is below average melting for the 1981-to-2010 reference period. Surface melting has been low in the southeast, and has been limited to coastal regions at low elevations. The western and northeastern coastal areas have a slightly higher-than-average number of melt days through mid-August. Beginning on July 16, a broader area of northern Greenland began to melt, spreading and persisting until August 3. Both the northeastern and northwestern coastal areas were affected. At its peak, July 22 to 24, over 30 percent of the ice sheet experienced some surface melting each day, although several recent years had similar or larger melt areas on those days. The higher-than-average-melt-days area was confined to lower elevations of the ice sheet.
Conditions in context
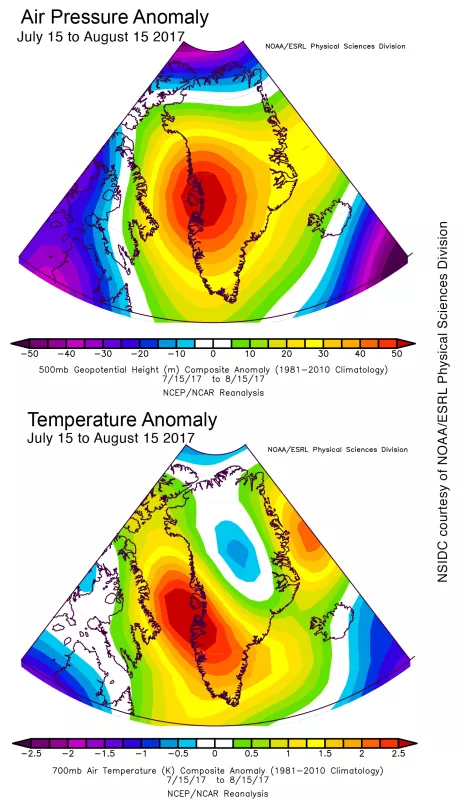
The surge in surface melt extent coincided with a period of high air pressure centered over Greenland's western coast, with below-average pressure areas on all sides. This produced strong southerly winds along the western flank, increasing that area's air temperature and surface melt extent. This warm pulse of air traveled northward and around the northern coast of Greenland. However, in the far north, sharply cooler conditions surrounding the strong melt event led to below-average temperatures for the 31-day period in the island's north-central parts.
Fires around the ice
While the ice sheet melt has been unremarkable, wild fires on the coastal tundra have made news this season. Wild fires in Greenland are rare with only a handful detected in a typical year by the Fire Information for Resource Management System (FIRMS). FIRMS uses the NASA Moderate Resolution Imaging Spectroradiometer (MODIS) data to detect fires worldwide. In 2017 the number of fires in Greenland spiked. The fire triggers are unknown but NSIDC researchers Jeff Thompson and Lora Koenig have been investigating vegetation change over the past fifteen years around the Greenland ice sheet. Their research shows a complicated pattern of vegetation change that makes the land areas surrounding the ice sheet more prone to large fires. In some regions, warming leads to increased plant productivity by providing more growing days; however, in other areas an earlier drying of the soil and early browning of the vegetation result in a landscape more susceptible to fire. This research is ongoing but highlights how warming in the Arctic can have both a positive and negative effect on vegetation.
Field notes: Greenland's percolation zone, then and now
The Greenland Traverse for Accumulation and Climate Studies (GreenTrACS) team completed a successful eight-week snowmobile traverse across the western side of the Greenland ice sheet, through a region where extensive surface melt refreezes in the snow below the surface. This area is called "the percolation zone" of the ice sheet. The collaborative project, funded by the National Science Foundation (NSF), involved professors and students from Dartmouth College, Boise State University, and the University of Maine. This year's field team drilled nine 25 to 33 meter (82 to 108 feet) ice cores (totaling 260 meter or 853 feet), and collected about 3000 kilometers (1864 miles) of Global Positioning System (GPS) elevation data and ground-penetrating radar profile data. The team also measured albedo at 34 sites, conducted several kite-borne aerial photography surveys, and measured surface density, temperature profiles, and snow grain size in 25 snowpits. Several ice cores were collected at locations that the Program for Regional Climate Assessment (PARCA) had measured in the 1990s to compare changes in accumulation and meltwater retention. The cores were photographed in the field and will be analyzed for the number of refrozen melt layers, and overall snow accumulation, at Dartmouth College.
Greenland's ice sheet may grow in 2017
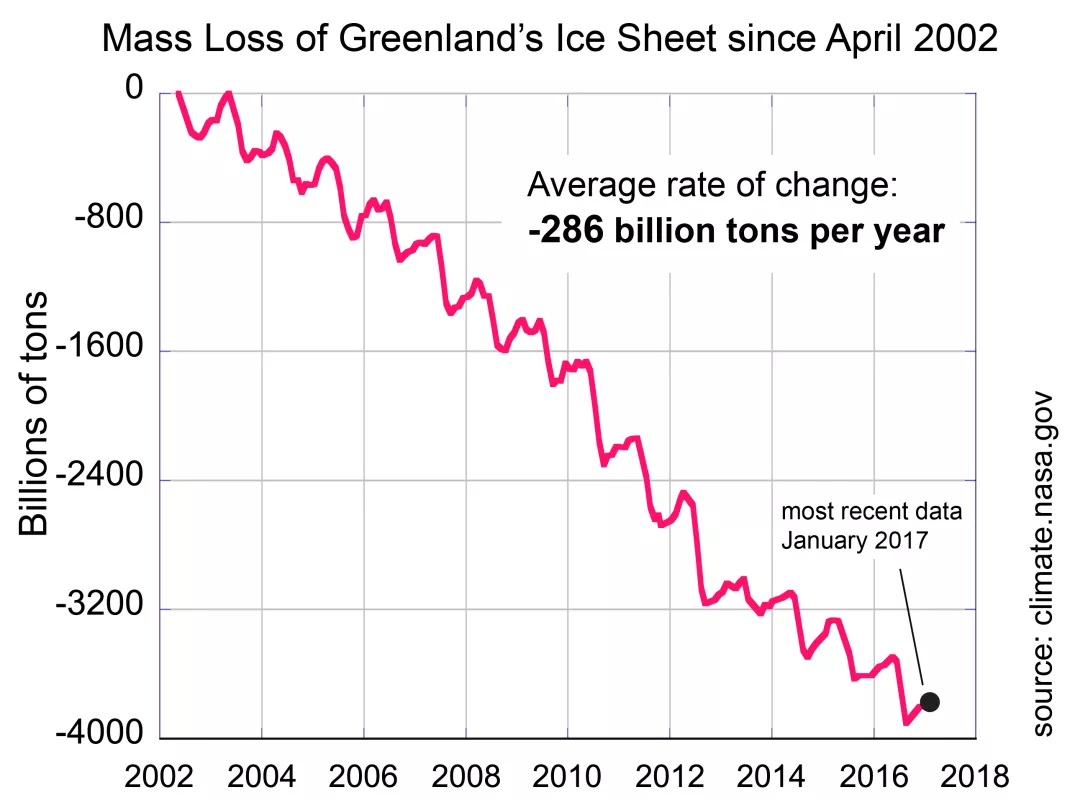
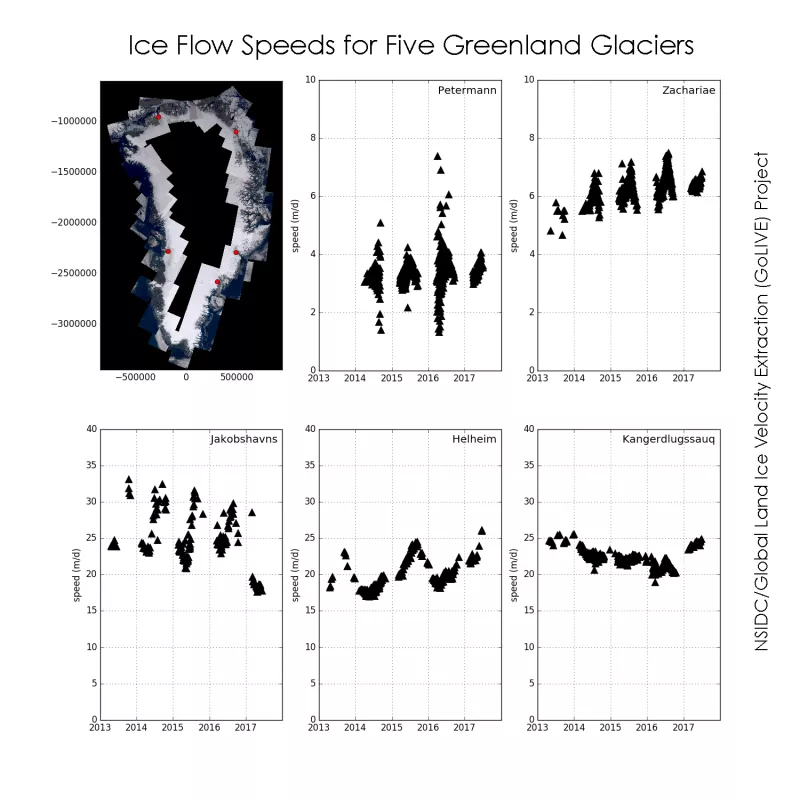
For at least the past seventeen years (since probably 1996, according to recent publications) the Greenland ice sheet has been losing ice on an annual basis. This is best illustrated by data from the Gravity Recovery and Climate Experiment (GRACE) satellite, which measures the change in mass over the entire ice sheet through changes in Earth’s gravitation. Some years, such as 2012, have much larger losses, and others like 2013 lost little, but every year in recent decades has had at least a slight net reduction in ice. Overall the trend has been 286 ± 21 billion tons of ice per year, equal to about 0.8 millimeter sea level rise (0.03 inches). However, the events of the 2016-to-2017 annual snowfall and melt cycle suggest that this year will see a net gain for the ice sheet. The low melt for the 2017 summer, and the greater-than-average snowfall for the southeastern coastal area, added a net amount of snow and ice to the island’s ice sheet. This combination of surface melting, evaporation, runoff, and the snowfall (and rain) is called the surface mass balance (SMB). It represents all the components from the atmosphere that contribute ice and snow to the ice sheet. As of late August, model estimates of the remaining snowfall on the Greenland ice sheet showed about 70 billion tons more snow than the 1981-to-2010 average, and roughly 400 billion tons more than the record 2012 loss. This is primarily due to excess accumulation in southeastern Greenland in the past winter and spring. Several major accumulation events in October, February, and May, led to a snowpack roughly 500 millimeters (20 inches) thicker than average in the areas near Kangerlugssuaq and Helheim Glaciers. Observations at automatic weather stations sites along Greenland's southeastern coast confirm model results. For the balance of mass and volume for the entire ice sheet, the SMB is combined with total ice loss from ice flowing through outlet glaciers into the ocean. Given that Greenland has retained more snow input this year, ice export would need to increase to bring the ice sheet into balance or continue with annual ice loss. To estimate recent changes in ice flow, we used near-real-time measurements of the surface speed of some major ice outlets for the Greenland ice sheet from the GoLIVE data set. For five major Greenland outlets, ice speed has varied since 2016, but a significant slowing of the largest glacier Jacobshavn has offset small increases of this subset. It is likely that 2017 will see a net increase in Greenland’s ice mass for the first time this century. However, a more detailed analysis of all the island's glaciers and surface elevation changes will be needed to confirm this.
Further reading
Fahnestock, M., T. Scambos, T. Moon, A. Gardner, T. Haran, and M. Klinger. 2016. Rapid large-area mapping of ice flow using Landsat 8. Remote Sensing of Environment, 185, pp.84-94. doi.org/10.1016/j.rse.2015.11.023.
Shepherd, A., E. R. Ivins, A. Geruo, V. R. Barletta, M. J. Bentley, S. Bettadpur, K. H. Briggs, D. H. Bromwich, R. Forsberg, N. Galin, and M. Horwath. 2012. A reconciled estimate of ice-sheet mass balance. Science, 338. Issue 6111, pp.1183-1189. doi: 10.1126/science.1228102.
Thompson, J.A. and L. Koenig. 2016, February. Evidence for increasing desiccation of vegetation in Greenland. In AGU Fall Meeting Abstracts.
Thompson, JA and L. Koenig. 2017, in revision. Land surface phenology in Greenland and links to cryospheric change. Earth and Space Science.
The Greenland Traverse for Accumulation and Climate Studies (GreenTrACS) blog
The 2017 Greenland ice sheet SMB simulated by MARv3.5.2 in real time


