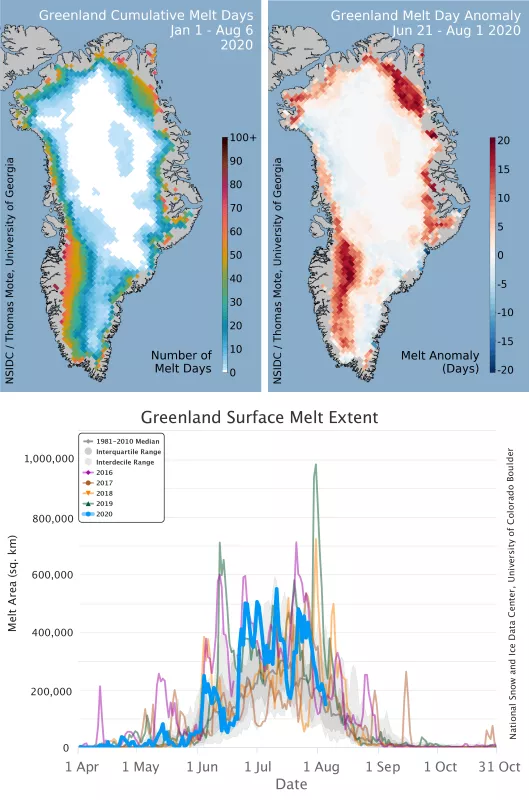
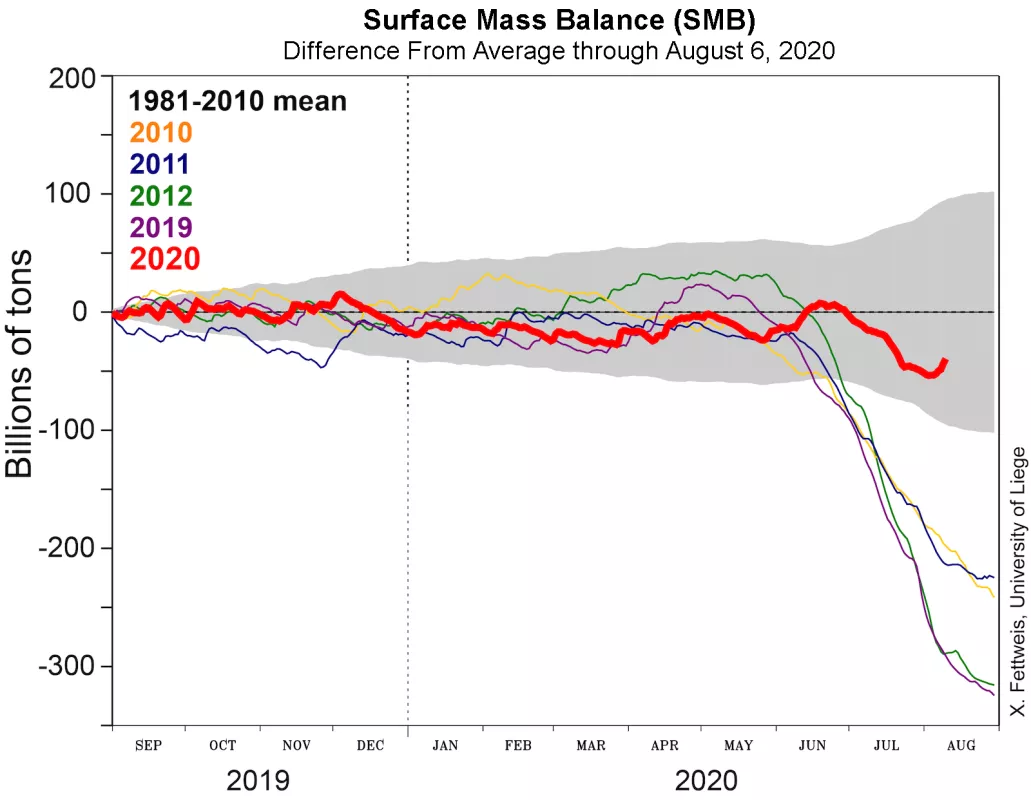
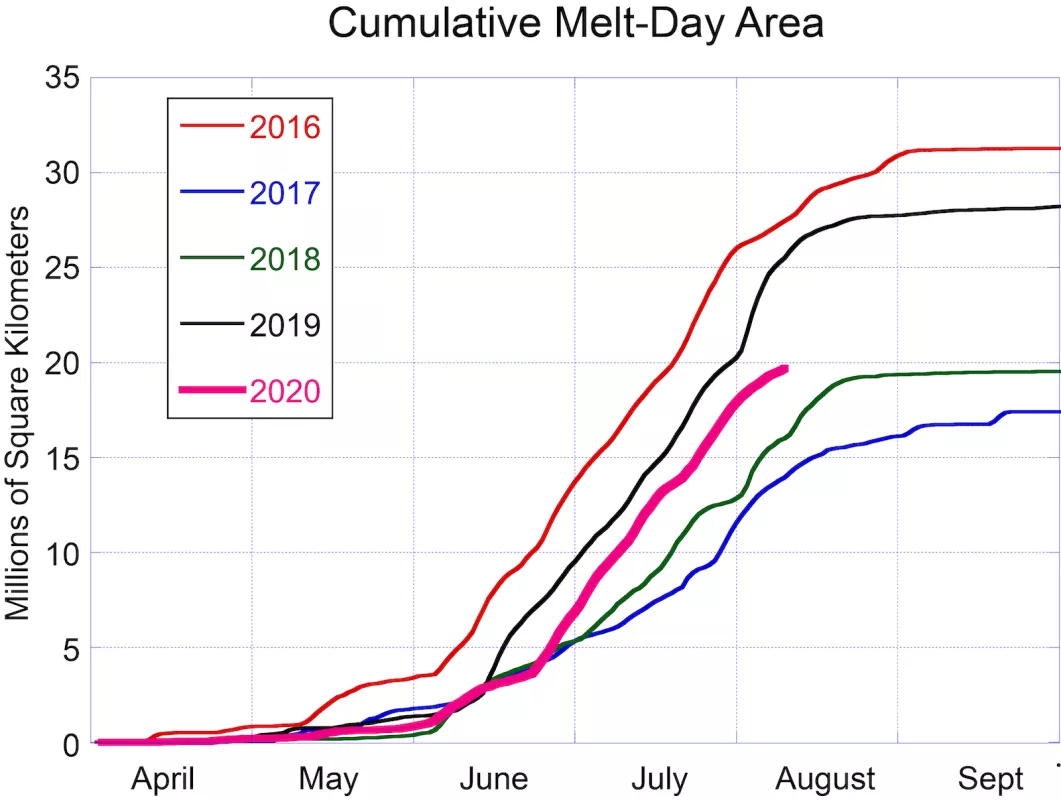
Melting through the peak of Greenland’s summer melt season has been well above the 1981 to 2010 average, but below the levels of many previous summers of the past decade. While the northeast and southwest areas of the ice sheet had significantly more melt than average, the melt extent over the southeast and northwest coasts was lower than average. The 2020 surface runoff to date is lower than in recent years.
Overview of conditions
The total aerial extent of surface melting through August 1, 2020, was well above the 1981 to 2010 average. Total melt-day extent was 18.6 million square kilometers (7.18 million square miles) for 2020 versus 14.4 million square kilometers (5.60 million square miles) for the 1981 to 2010 average. The season was marked by a series of moderate spikes in melt extent, primarily in the southeast and northwest. The peak one-day melt extent for 2020 to date was July 10, when 551,000 square kilometers (212,700 square miles), or 34 percent of the ice sheet surface, melted. The maximum number of melt days occurred in two areas, along the southwest edge and northeast corner of the ice sheet, at around 65 out of 123 days from April 1 to August 1, 2020. An isolated area near Helheim Glacier and Kangerlussuaq reached 75 days out of 123 days.
Conditions in context
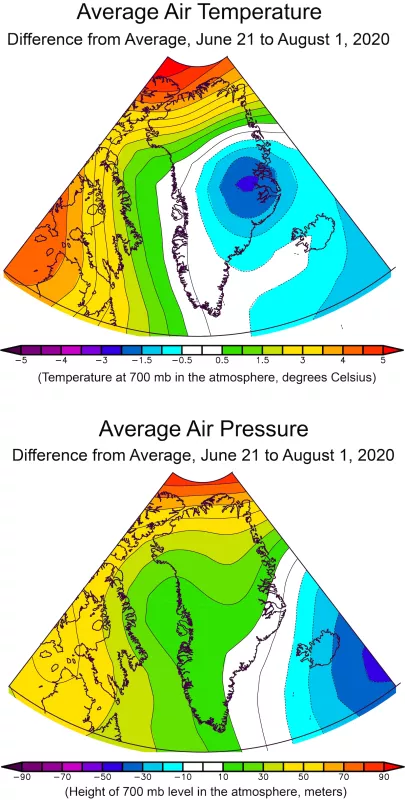
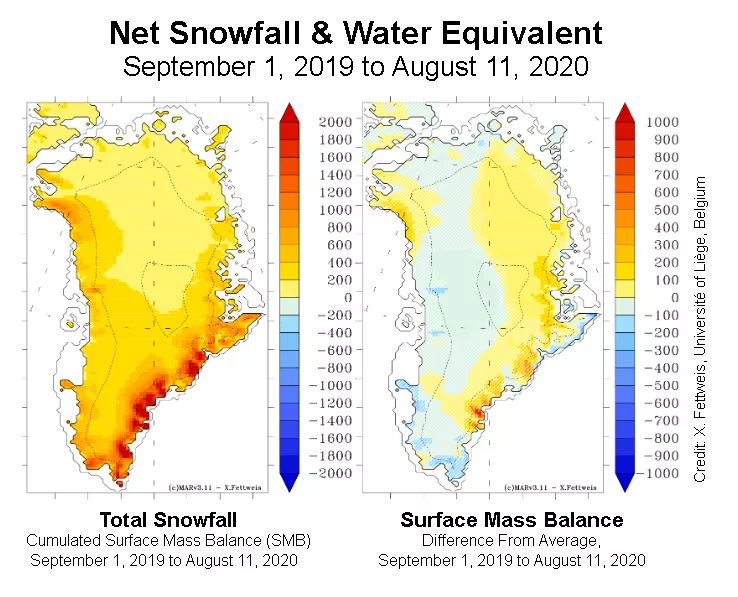
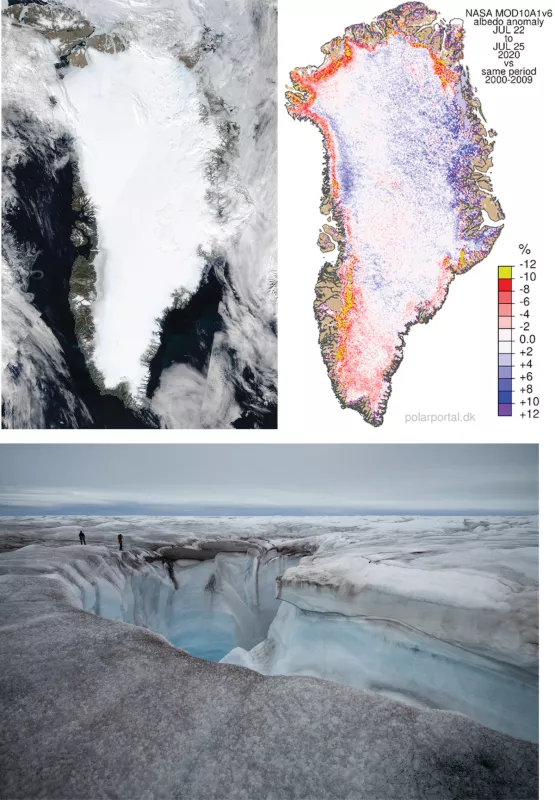
Temperatures in the Greenland region were near average over the June 21 to August 1, 2020 period, with higher than average temperatures of up to 3.5 degrees Celsius (6 degrees Fahrenheit) limited to the far northern flank of the ice sheet, and lower than average temperatures of 1.5 to 2 degrees Celsius (3 to 4 degrees Fahrenheit) near the Scoresby Sund area (Figure 2). Wind patterns over the ice sheet favored a westward to southwestward flow, bringing air off the far northern Atlantic Ocean (Norwegian Sea) across the ice sheet. The variation in circulation this year is nearly the opposite of that of Summer 2019, which resulted in the melting and snowfall being less extreme this year compared to last year (Figure 3). Net mass balance of snowfall—snow and rain input minus evaporation and melt runoff—is below average all along the western side of the ice sheet but near average to slightly above average along most of the eastern coastal area (Figure 4).
Fade to black
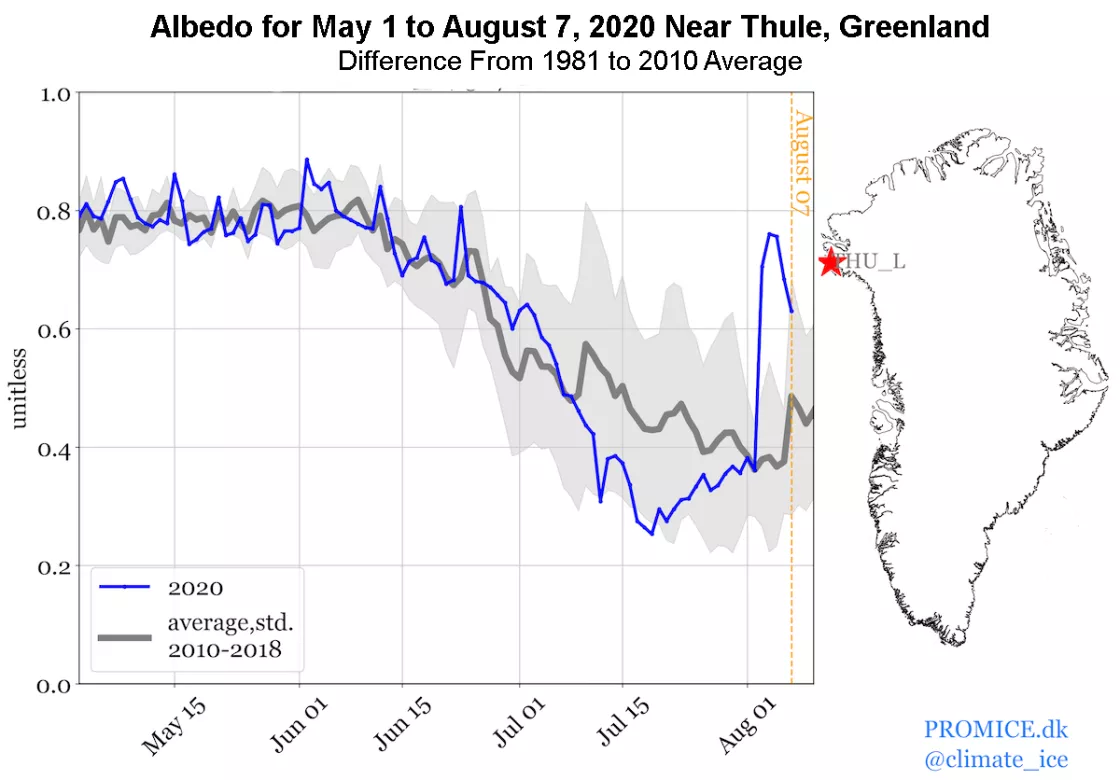
Below-average summer snowfall along the western side of Greenland increased ablation, exposing ancient dust and soot on the surface (Figure 6). This has led to some of the darkest snow-cover conditions seen to date in Greenland along its western ablation area. The ablation area is the area of the glacier where more glacier mass is lost than gained, and where all the winter snow melts each year, and older underlying ice is exposed and melts further. Conditions near Humbolt Glacier and the Thule US military installation in the northwest were also unusually dark (Figure 7). High runoff in these areas leads to meltwater streams that often flow into the ice sheet and down to the bedrock below, creating dramatic openings in the ice sheet called moulins (Figure 6).
In memoriam of Koni Steffen
[On Saturday, August 8, Swiss scientist and professor Konrad Steffen died in an accident while conducting field work in Greenland. Koni, as he was known to many, devoted his professional life to the study of polar climate and the processes of weather and snow melt on Greenland. He was director of the Swiss Federal Institute for Forest, Snow and Landscape Research (WSL), a forest and environmental group based in Zurich, and was former director of University of Colorado’s Cooperative Institute for Environmental Sciences (CIRES), which is the parent institute of the National Snow and Ice Data Center (NSIDC). Koni embraced and relished his work in Greenland, and introduced dozens of dignitaries and scientists to the ice sheet, his favorite landscape. He was 68-years old.
