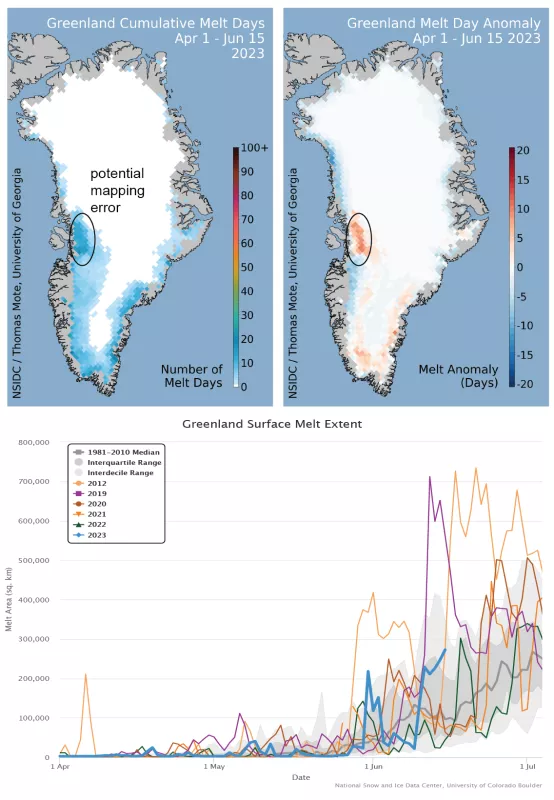
The melt season for the Greenland Ice Sheet has been near-average so far, with cool conditions in northern Greenland despite warm weather in nearby Arctic Canada. A small region of the ice sheet may not be properly mapped as it shows a higher number of melt days than is likely considering the observed weather for that area. The team will be re-evaluating the melt algorithm for this region in the coming weeks. As of the post, record or near-record heat is being observed at the Greenland Summit, and is forecast to continue through the week. A following report in July will cover this event.
Overview of conditions
As of June 15, Greenland has had a near-average melt year. Total melt-day area ranked twenty-third in the 45-year-satellite record with the present data, which includes a small region near Jakobshavn Glacier that is over-reporting melt in an area with below-freezing air temperatures (Figure 1). Surface melting can occur when air temperatures at 2 to 3 meters (7 to 10 feet) above the surface (the average height of sensors on a weather station) are within a few degrees of melting, but we are re-evaluating the melt algorithm in this region. Melting is slightly above average in both southeastern and southern Greenland, and slightly below average along most of the rest of the western coast. As of June 15, neither the South Summit nor any regions along the northwestern, northern, or northeastern coast have experienced significant surface melting.
Conditions in context
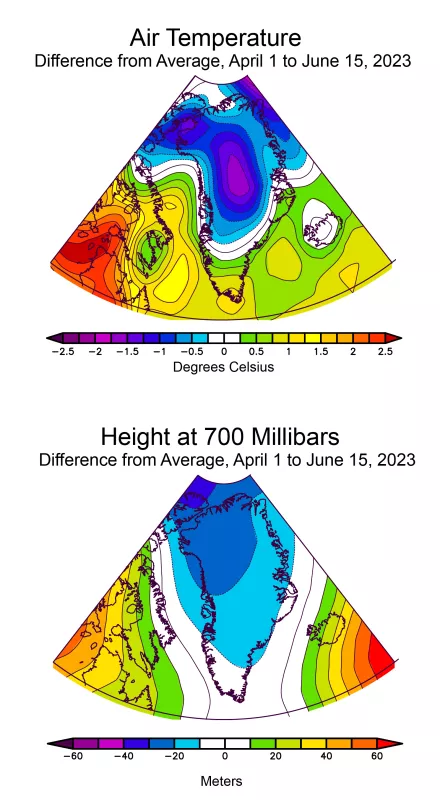
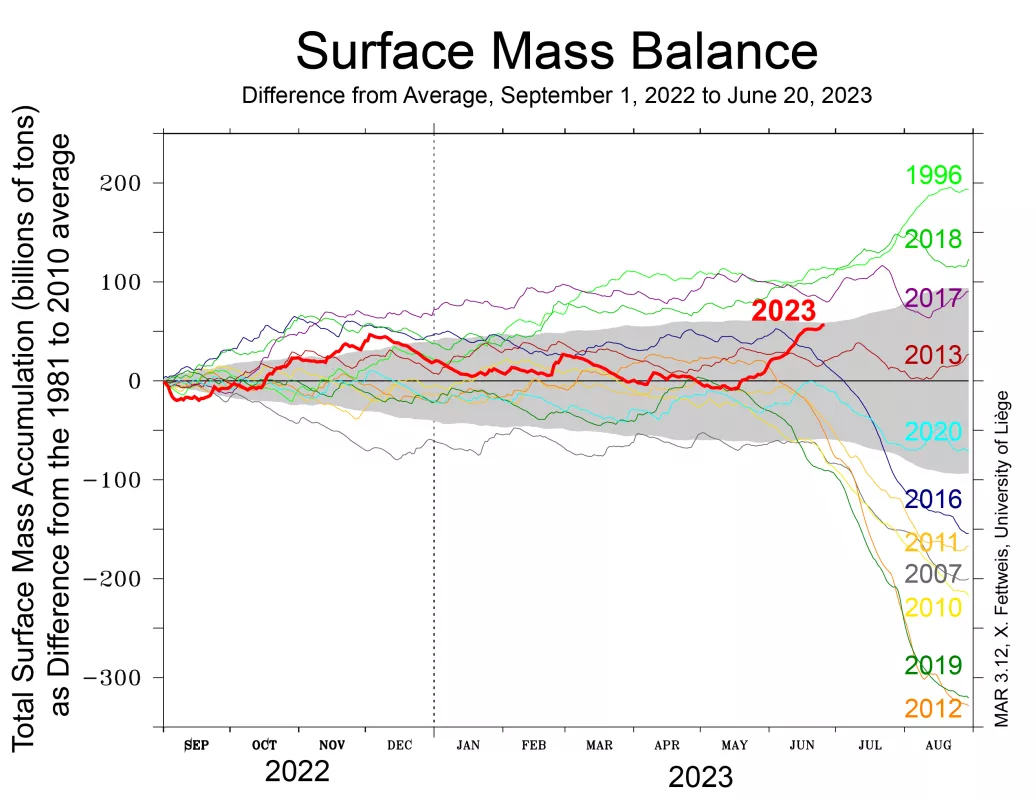
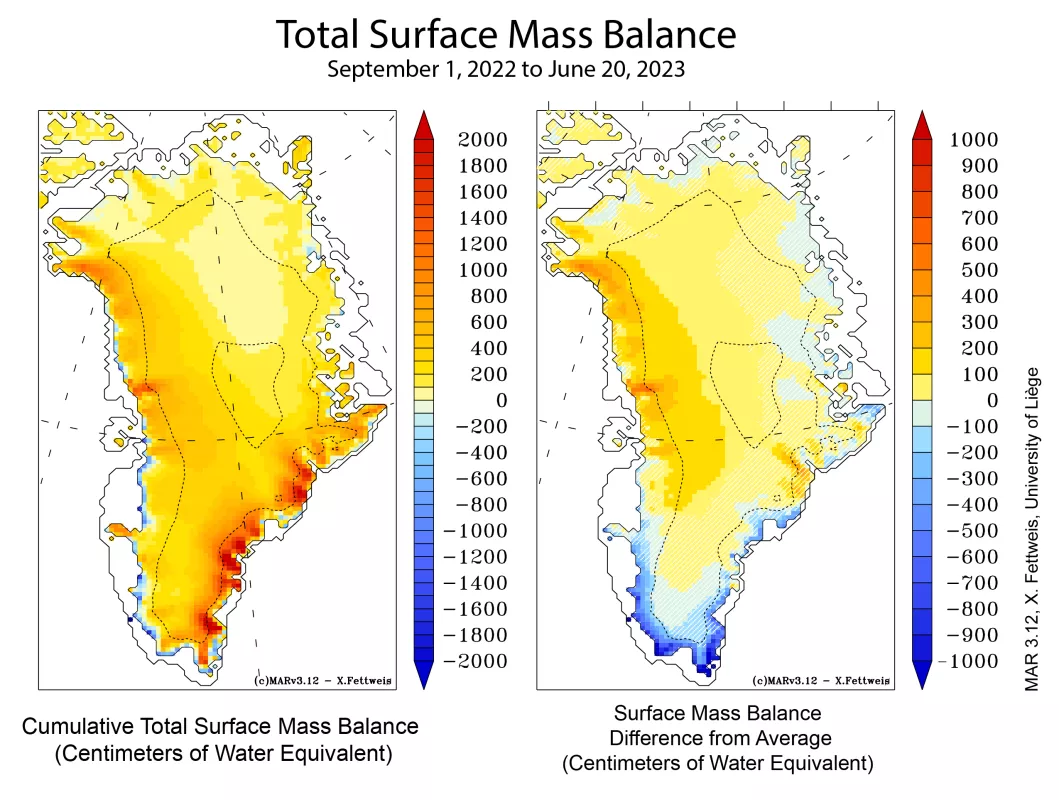
Air temperatures near the southern tip of Greenland have been 1 degree Celsius (2 degrees Fahrenheit) above average, but temperatures elsewhere on the island have been at or below average (Figure 2). The Summit area and northward have recorded temperatures about 1.5 degrees Celsius (3 degrees Fahrenheit) below average. Winds from the north along the western coast of the island brought cooler conditions, driven by generally low air pressure centered on Greenland’s north coast. The slightly warmer conditions and more frequent melting along the southern and southeastern coast were a result of winds coming from the south over that region. Total surface mass balance, which at the beginning of the melt season is mostly winter snowfall accumulation, is now slightly above the 1981 to 2010 reference period by about 50 billion tons (Figure 3). However, winter snowfall accumulation has been below average along the southern coastal area, by as much as 800 millimeters (32 inches) of water equivalent (Figure 4). Along the western coast, snowfall accumulation is above average. Combined with the cool conditions, thicker accumulated winter snowpack may slow the progression of melt in this otherwise high melt area of the ablation, or exposed ice and run-off, region. With persistent winter snowfall, the surface remains bright longer, and therefore reflects more of the incoming sunlight. However, along the entire southern coast, lower winter snowfall followed by above average surface melt will promote increased runoff as the melt season progresses.
Early trends in temperature
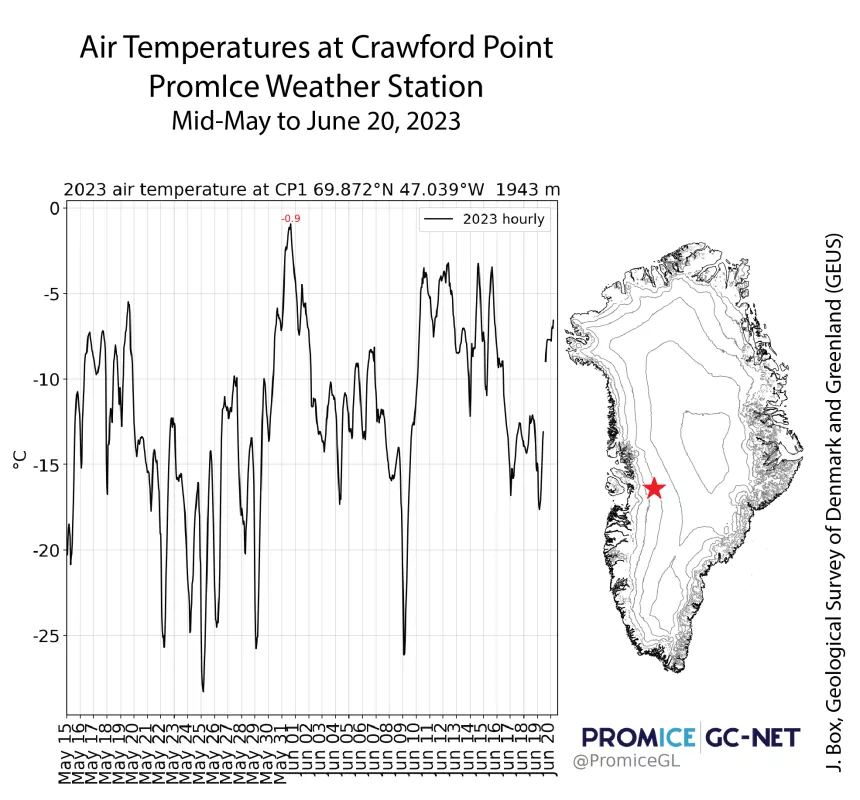
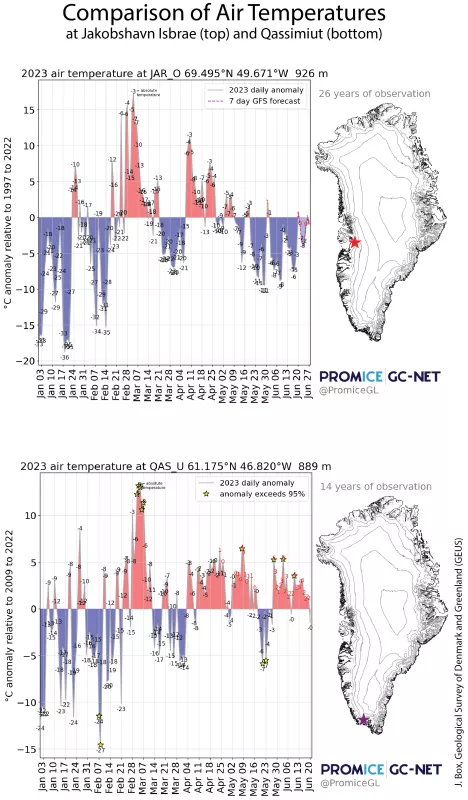
Air temperatures for the potentially over-estimated melt area discussed above has been below freezing for the entire May to June period, with a maximum temperature of -0.9 degrees Celsius (30 degrees Fahrenheit) (Figure 5). As of this post, extensive melting has now reached the area. A comparison of the difference from average conditions for two regions through June 20 indicates that the area near Jakobshavn Isbrae has had below temperatures since about May 10, whereas Qassimiut has had above average temperatures since mid-February (Figure 6).
